Figures & data
Figure 1 Flow diagram of the experiment.
Abbreviations: Ti, titanium; DC, direct current; HF, hydrofluoric acid; TNT, TiO2 nanotube; Zn, zinc; ZnO, zinc oxide; SEM, scanning electron microscopy; XPS, X-ray photoelectron spectroscopy; XRD, X-ray diffraction; LPS, lipopolysaccharides; CCK-8, cell counting kit-8 assay; LDH, lactate dehydrogenase assay; CLSM, confocal laser scanning microscopy; qPCR, quantitative real-time polymerase chain reaction; ELISA, enzyme-linked immunosorbent assay; ALP, alkaline phosphatase assay; ARS, Alizarin red S assay.
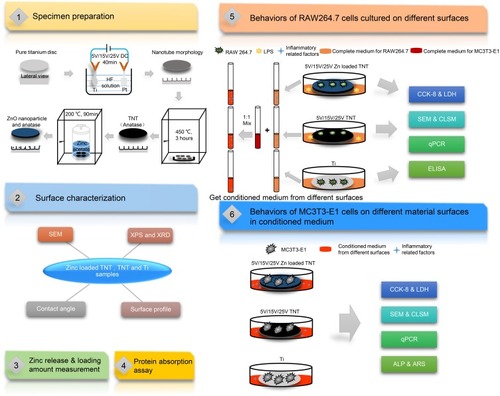
Table 1 Primers Used for qPCR
Table 2 EDS and ICP-AES Assay for TNT and Zinc-Incorporated TNT Samples
Figure 2 Surface morphology of the samples observed by SEM with the insets showing the higher-magnification images.
Notes: (A) 5V, (B) 15V, (C) 25V, (D) 5VZn, (E) 15VZn, (F) 25VZn, (G) pure Ti. The red arrows indicate zinc nanoparticles.
Abbreviations: SEM, scanning electron microscopy; Ti, titanium; Zn, zinc; 5V/15V/25V, TNTs formed by anodization at a voltage of 5V/15V/25V; 5VZn/15VZn/25VZn, ZnO nanoparticles incorporated in 5V/15V/25V TNTs.
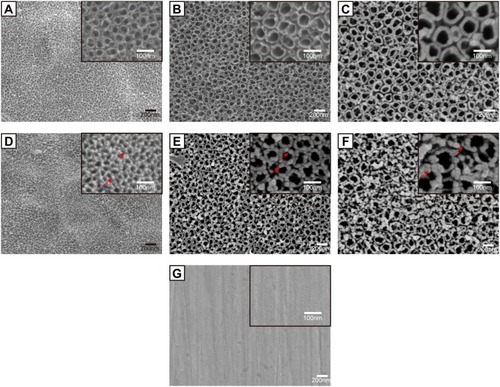
Figure 3 Surface chemical composition analyses by XRD (A) and XPS (B).
Abbreviations: XRD, X-ray diffraction; XPS, X-ray photoelectron spectroscopy.
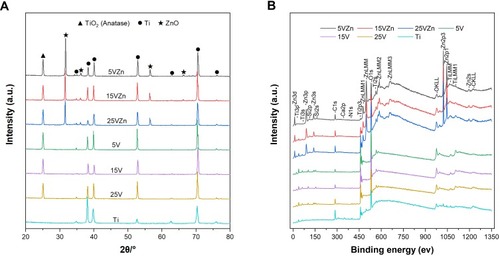
Figure 4 Roughness values (A) and contact angles (B) of samples.
Notes: Data are expressed as the mean ± standard deviation (n=3). $Denotes the statistical significance between Ti and other groups. #Denotes the statistical significance between each Zn-incorporated TNT group and its TNT counterpart group. &Denotes the statistical significance between different labeled groups. ($P<0.05, #P<0.05, &P<0.05, ANOVA.)
Abbreviation: Ra, arithmetical mean deviation of the profile.
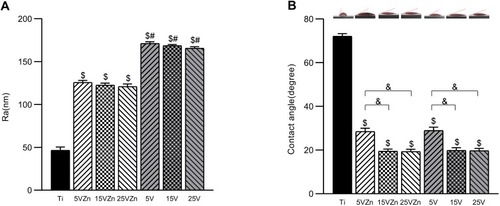
Figure 5 Zinc release profiles of zinc-incorporated samples.
Notes: The cumulative release amount curve (A) and cumulative release percentage curve (B) were assessed by ICP-AES; data are expressed as the mean ± standard deviation (n=3).
Abbreviation: ICP-AES, inductively coupled plasma atomic emission spectrometry.
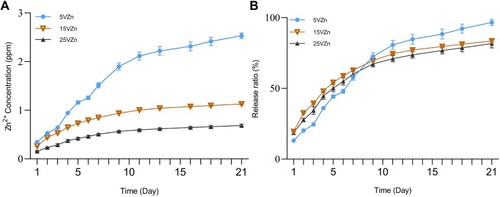
Figure 6 Protein absorption assay of samples.
Notes: Data are expressed as the mean ± standard deviation (n=3). $Denotes the statistical significance between Ti and other groups. ($P<0.05, ANOVA.)
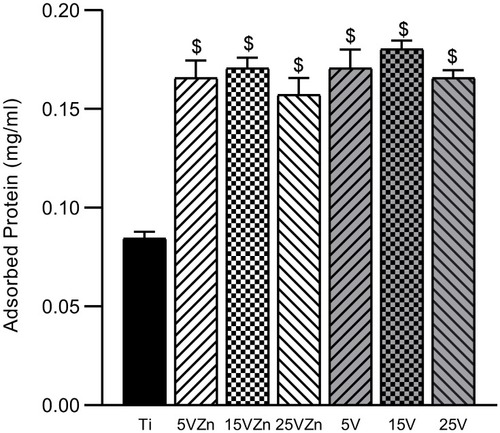
Figure 7 CCK-8 (A) and LDH activity (B) results of RAW264.7 cells after culturing for 1, 3, 5 and 7 days on different surfaces.
Notes: Data are expressed as the mean ± standard deviation (n=3). nsDenotes no statistical significance between all different groups. $Denotes the statistical significance between Ti and other groups. #Denotes the statistical significance between each Zn-incorporated TNT group and its TNT counterpart group. &Denotes the statistical significance between different labeled groups. ($P<0.05, #P<0.05, &P<0.05, ANOVA.)
Abbreviations: CCK-8, cell counting kit-8; LDH, lactate dehydrogenase.
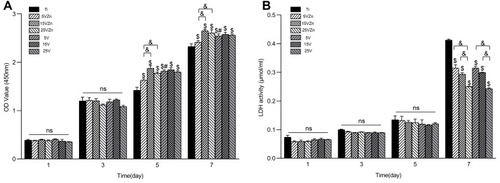
Figure 8 SEM images of RAW 264.7 cell morphology after culturing for 1 and 3 days on different samples.
Notes: Uppercase letters and lowercase letters indicate the images after 1 and 3 days of culture: (A, a), Ti; (B, b), Ti surface with 1 μg/mL LPS treatment; (C, c), 5VZn surface with 1 μg/mL LPS treatment; (D, d), 5V surface with 1 μg/mL LPS treatment; (E, e), 15VZn surface with 1 μg/mL LPS treatment; (F, f), 15V surface with 1 μg/mL LPS treatment; (G, g), 25VZn surface with 1 μg/mL LPS treatment; (H, h), 25V surface with 1 μg/mL LPS treatment. White arrows indicate M1-like cell shape and red arrows indicate M2-like cell shape.
Abbreviations: SEM, scanning electron microscopy; LPS, lipopolysaccharides.
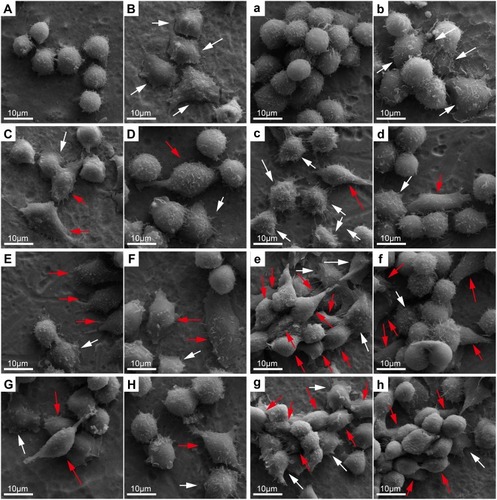
Figure 9 CLSM images of RAW 264.7 cells after culturing for 1 and 3 days on different samples.
Notes: Uppercase letters indicate the day 1 images, lowercase letters indicate the day 3 images: (A, a), Ti; (B, b), Ti surface with 1 μg/mL LPS treatment; (C, c), 5VZn surface with 1 μg/mL LPS treatment; (D, d), 5V surface with 1 μg/mL LPS treatment; (E, e), 15VZn surface with 1 μg/mL LPS treatment; (F, f), 15V surface with 1 μg/mL LPS treatment; (G, g), 25VZn surface with 1 μg/mL LPS treatment; (H, h), 25V surface with 1 μg/mL LPS treatment.
Abbreviations: CLSM, confocal laser scanning microscope; LPS, lipopolysaccharides.
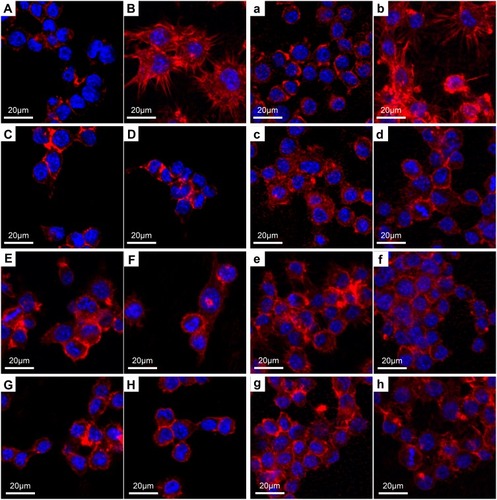
Figure 10 Gene expression changes of inflammation-associated cytokines assayed by qPCR.
Notes: Data are expressed as the mean ± standard deviation (n=3). $Denotes the statistical significance between Ti and other groups. #Denotes the statistical significance between each Zn-incorporated TNT group and its TNT counterpart group. &Denotes the statistical significance between different labeled groups. ($P<0.05, #P<0.05, &P<0.05, ANOVA.)
Abbreviation: qPCR, quantitative real-time polymerase chain reaction.
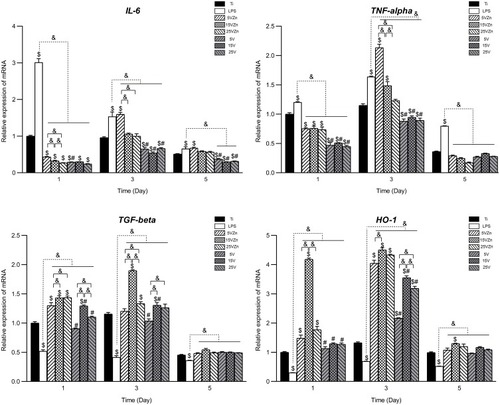
Figure 11 Secretion level changes of inflammation-associated cytokines in cell supernatant assayed by ELISA.
Notes: Data are expressed as the mean ± standard deviation (n=3). $Denotes the statistical significance between Ti and other groups. #Denotes the statistical significance between each Zn-incorporated TNT group and its TNT counterpart group. &Denotes the statistical significance between different labeled groups. ($P<0.05, #P<0.05, &P<0.05, ANOVA.)
Abbreviation: ELISA, enzyme-linked immunosorbent assay.
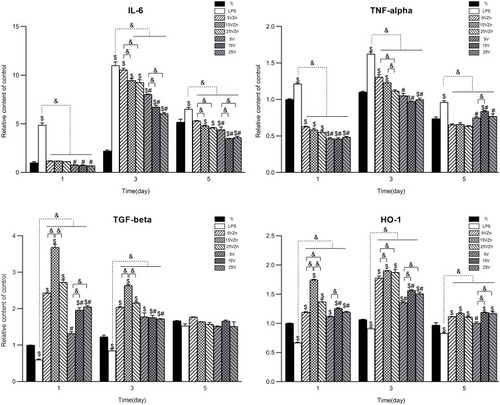
Figure 12 CCK-8 (A) and LDH activity (B) results of MC3T3-E1 cells after culturing for 1, 3, 5 and 7 days on different surfaces.
Notes: Data are expressed as the mean ± standard deviation (n=3). nsDenotes no statistical significance between all different groups. $Denotes the statistical significance between Ti and other groups. #Denotes the statistical significance between each Zn-incorporated TNT group and its TNT counterpart group. &Denotes the statistical significance between different labeled groups. ($P<0.05, #P<0.05, &P<0.05, ANOVA.)
Abbreviations: CCK-8, cell counting kit-8; LDH, lactate dehydrogenase.
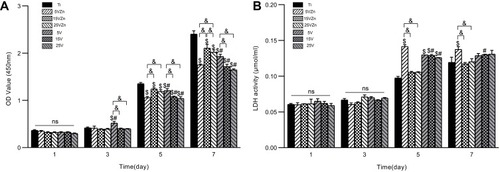
Figure 13 SEM images of MC3T3-E1 cell morphology on different samples after culturing for 1 and 3 days with the insets showing the higher-magnification images from the red box.
Notes: Uppercase letters indicate the day 1 images, lowercase letters indicate the day 3 images: (A, a), 5VZn surface cultured with CM; (B, b), 15VZn surface cultured with CM; (C, c), 25VZn surface cultured with CM; (D, d), 5V surface cultured with CM; (E, e), 15V surface cultured with CM; (F, f), 25V surface cultured with CM; (G, g), Ti.
Abbreviations: SEM, scanning electron microscopy; CM, conditioned medium.
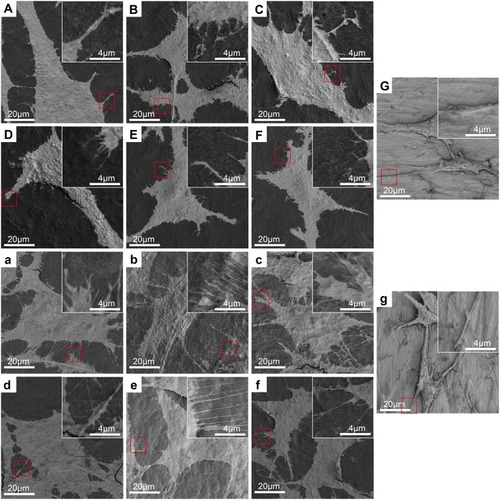
Figure 14 CLSM images of MC3T3-E1 cell morphology on different samples after culturing for 1 and 3 days (A–G, a–g); the quantitative analysis of immunofluorescence intensity of vinculin is also shown (H).
Notes: Uppercase letters indicate the day 1 images, lowercase letters indicate the day 3 images: (A, a), 5VZn surface cultured with CM; (B, b), 15VZn surface cultured with CM; (C, c), 25VZn surface cultured with CM; (D, d), 5V surface cultured with CM; (E, e), 15V surface cultured with CM; (F, f), 25V surface cultured with CM; (G, g), Ti. (H) The relative immunofluorescence intensity of vinculin on different surfaces, compared to Ti. Data are expressed as the mean ± standard deviation (n=3). $Denotes the statistical significance between Ti and other groups. #Denotes the statistical significance between each Zn-incorporated TNT group and its TNT counterpart group. &Denotes the statistical significance between different labeled groups. ($P<0.05, #P<0.05, &P<0.05, ANOVA.)
Abbreviations: CLSM, confocal laser scanning microscope; CM, conditioned medium.
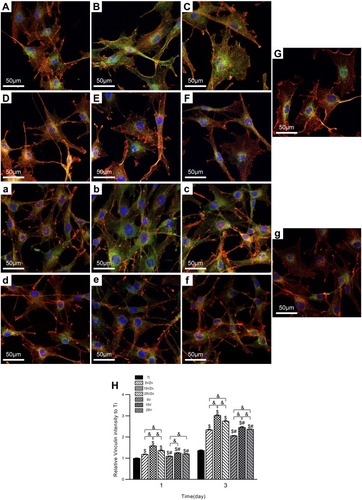
Figure 15 Expression of osteogenic-related gene levels assayed by qPCR.
Notes: Data are expressed as the mean ± standard deviation (n=3). $Denotes the statistical significance between Ti and other groups. #Denotes the statistical significance between each Zn-incorporated TNT group and its TNT counterpart group. &Denotes the statistical significance between different labeled groups. ($P<0.05, #P<0.05, &P<0.05, ANOVA.)
Abbreviation: qPCR, quantitative real-time polymerase chain reaction.
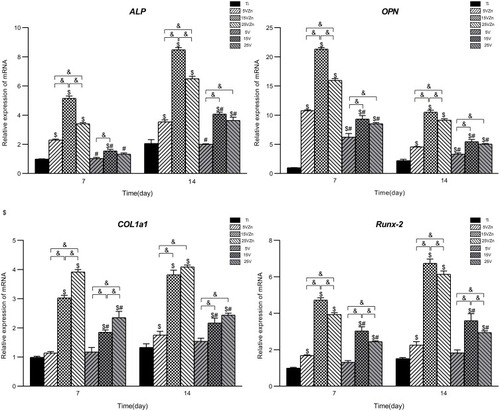
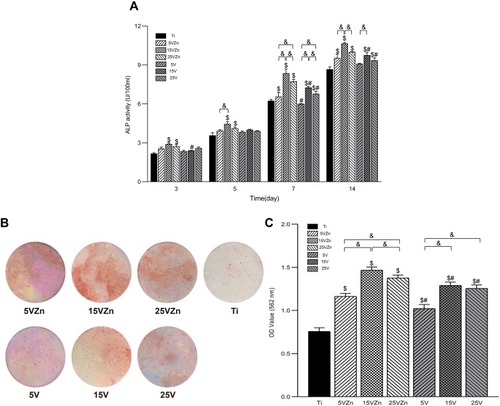
Figure 16 ALP activity of MC3T3-E1 cells cultured in CM for 3, 5, 7 and 14 days (A); and images (B) and OD values (C) of extracellular mineralization of MC3T3-E1 cells cultured in CM for 21 days. The Ti group was used as control (cultured without CM).
Notes: Data are expressed as the mean ± standard deviation (n=3). $Denotes the statistical significance between Ti and other groups. #Denotes the statistical significance between each Zn-incorporated TNT group and its TNT counterpart group. &Denotes the statistical significance between different labeled groups. ($P<0.05, #P<0.05, &P<0.05, ANOVA.)
Abbreviations: ALP, alkaline phosphatase; CM, conditioned medium.