Figures & data
Table 1 Orthogonal Test Factor Levels
Table 2 Experimental Design and Results of the Orthogonal Design L9(34)
Figure 1 The particle size and TEM photographs of the mPEG-PCL-ART-NPs. (A) The diameter of nanoparticles via DLS and (B) TEM photographs of the nanoparticles.
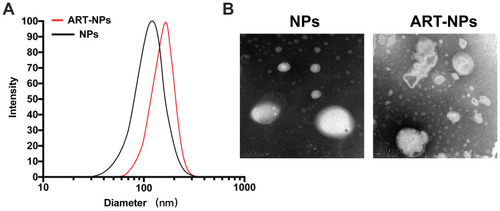
Figure 2 The release profiles of (A) ART, (B) mPEG-PCL-ART-NPs, and (C) ART-NPs-GelMA in different release media.
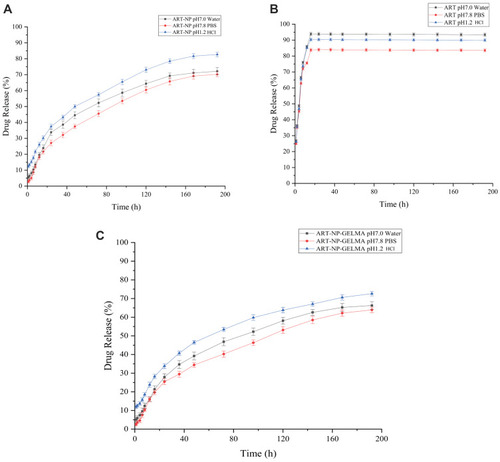
Figure 3 Representative confocal microscopy images of ART-FITC and mPEG-PCL-ART-FITC-NPs endocytosed by fibroblast cells for 2, 4, 6, 12 and 24 h. The scale bar is 50 µm.
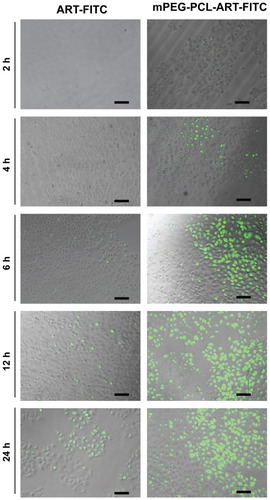
Figure 4 In vitro viability of cells in the presence of ART and mPEG-PCL-ART-NPs for 1, 5, 10 and 20 μg/mL, respectively. (A) Hela cells and (B) Hair cells.
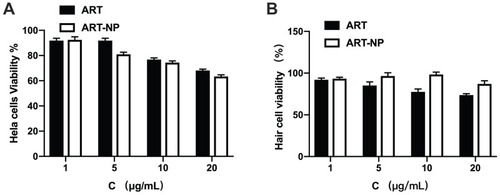
Figure 5 The degree of substitution and gelation ability of the GelMA hydrogels. The degree of substitution of the GelMA with various MA levels (A). Gelation ability mapping of the various GelMA compositions (3%: 1, 4, 7, and 10; 5%: 2, 5, 8, and 11; 7%: 3, 6, 9 and 12) and MA concentrations (1–3: 1% MA, 4–6: 2% MA, 7–9: 4% MA, 10–12: 8% MA) (B). Photographs showing the gelation ability of different degrees of substitution of the GelMA solution, before and after UV light crosslinking (C). *p<0.01 compared to the lowest concentration.
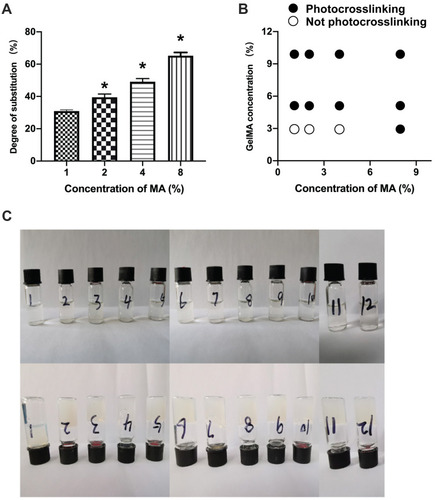
Figure 6 SEM of 5% GelMA with different concentrations of MA and 5% GelMA with nanoparticles and 4% MA (A). The cell viability of the various GelMA with different concentrations of MA (B). The mechanical properties of the 5% GelMA hydrogel with MA-1%, MA-2% and MA-4% (C and D) and the swelling ratio of the GelMA hydrogels, 5% GelMA hydrogel with MA-1%, MA-2% and MA-4% (E). *p<0.01 compared to the lowest degree of substitution.
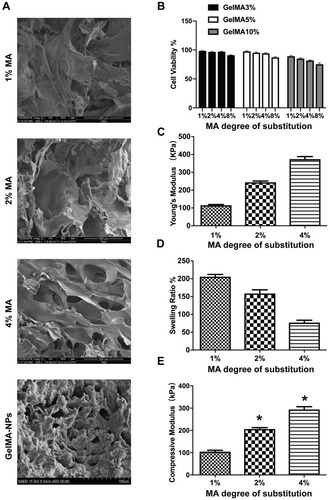
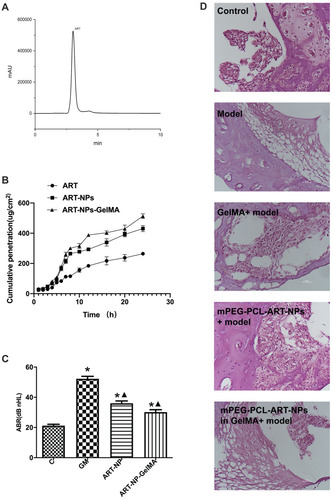
Figure 7 The skin penetration and histological evaluation of the ART-NP-GelMA hydrogel. Chromatogram of ART in receiving the liquid sample (A) and the cumulative penetration of ART, mPEG-PCL-ART-NPs and mPEG-PCL-ART-NPs-GelMA hydrogel at various times (B). Comparison of ABR (C) and representative H&E stained images of guinea pig cochlea between the control group, GM, GM+ mPEG-ART-NPs, and GM+ ART-NPs-GelMA hydrogel at 14 days later (D). *p<0.01, compared with control group; ▲p<0.01, compared with GM group. Scale bars = 2.5 μm.