Figures & data
Figure 1 Graphical depiction of brain cell activation and the experimental cell culture-based models. (A) Activated by tissue damage, microglial cells enter their activated state characterized by an amoeboid shape and the production of pro-inflammatory cytokines such as IL1β, IL6, TNFα and TGFβ. These cytokines exert neuroinflammatory reaction and turn astrocytes to a reactive state in which they upregulate the expression of gliosis specific genes. (B) Human microglial cells HMC3 were stimulated with LPS to induce an inflammatory reaction, which is amongst others represented by the production of inflammatory cytokines like IL1β, IL6, TNFα and TGFβ1. Expression of these mediators was analyzed on mRNA level by qPCR to investigate the modulating effects of liposomal-encapsulated curcumin (LipoCur) in comparison to free curcumin and empty liposomes on the inflammatory response of microglial cells. (C) In order to transfer the inflammatory response to astrocytes, human SVGA astrocytes were stimulated with a combination of the microglia produced cytokines IL1β, TNFα and TGFβ1 (with or without co-stimulation with LipoCur or free curcumin), and genes that are known to contribute to reactive gliosis and glial scar formation (Nestin, Vimentin, Tenascin-C, Fibronectin) were analyzed by qPCR. (D) To study the cellular reactions in their tissue environment, we stimulated murine organotypic brain slices with LPS and analyzed by cytotoxicity assay, qPCR and immunohistochemistry whether LPS effects could be ameliorated by co-incubation with LipoCur or free curcumin.
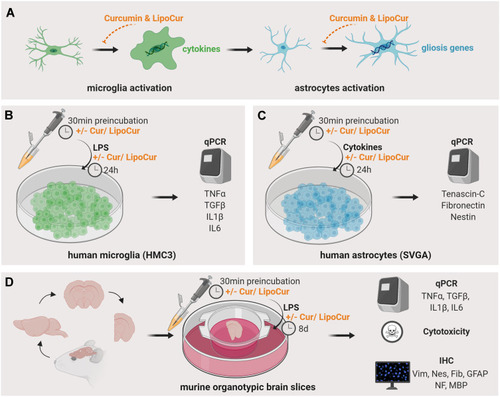
Table 1 Characterization of Empty and Curcumin Loaded Liposomes (LipoCur), Before and After Freeze-Drying
Figure 2 Physicochemical properties of curcumin loaded liposomes. Hydrodynamic diameter, polydispersity index (PdI) and zeta potential were determined of curcumin loaded liposomes substituted with different concentrations of trehalose before (A) and after (B) freeze-drying (n = 3 batches). Long-term analysis of hydrodynamic diameter (C), zeta potential (D) and PdI (E) of the freeze-dried liposomes using 10% trehalose revealed stability for at least 180 days. (n = 3 batches) (F) Curcumin loaded liposomes showed efficient sustained drug release over 96 h. The instability of curcumin is mirrored by decreasing cumulative curcumin concentrations after prolonged time periods (n = 3). The statistical significance of the long-term stability was determined by One-Way-ANOVA followed by Bonferroni’s multiple comparison test, comparing all days after freeze-drying with one another. A two-tailed paired t-test was employed to test for significance between liposomes before and directly after freeze-drying. *p<0.05, **p<0.005, ***p<0.001.
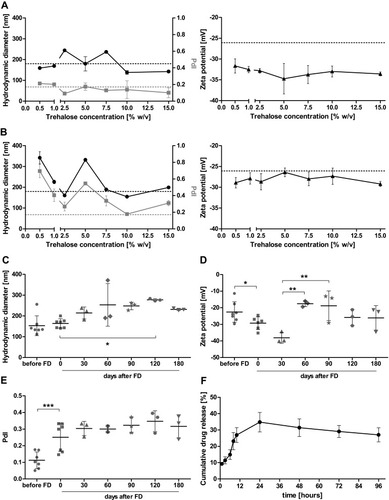
Figure 3 Ultrastructure of curcumin loaded and empty liposomes, cellular uptake and cell viability of HMC3 microglia cells and SVGA astrocytes upon incubation with liposomal and free curcumin. (A) Curcumin loaded liposomes and (B) empty liposomes were visualized by transmission electron microscopy (TEM) at different magnifications. Similar average sizes and size distributions could be obtained as with DLS measurements after 180 days. (C) Liposomes were labelled red using nile red, and cellular uptake was monitored after 24 h incubation with human microglia cells HMC3 or human astrocytes SVGA. Nuclei were counterstained with DAPI (shown in cyan) and membrane structures with Alexa Fluor-647 labelled wheat germ agglutinin (shown in blue) to visualize the localization of the red labelled liposomes within the cell boundaries. Representative images from n = 2 independent experiments, scale bars indicate 20 µm. (D) To test the influence of liposomal curcumin on cell viability, human microglia cells (HMC3, left) or astrocytes (SVGA, right) were incubated with different concentrations of free curcumin (free Cur), curcumin loaded liposomes (LipoCur) containing the same amounts of curcumin (a final concentration of 1 µM curcumin corresponds to 18 µg/mL loaded liposomes) or the corresponding amounts of empty liposomes (empty LP) for 3 days. Viability was determined in duplicates using a WST-assay for n = 4–10 independent experiments, graphs show mean values ± SD. For HMC3 microglia, there was no significant reduction in viability to be observed up to 10 µM for free curcumin (IC50 19.6 µM), and up to 1 µM for liposomal curcumin (IC50 5.3 µM). Empty liposomes only reduced microglia viability starting from 90 µg/mL (IC50 86.4 µg/mL). SVGA cells showed quite similar results while being a bit more sensitive, with IC50 values of 11.6 µM for free curcumin, 2.1 µM for liposomal curcumin and 36.4 µg/mL for empty liposomes. Statistical significant differences to unstimulated controls (corresponding to 100%) were analyzed by One-Way-ANOVA followed by Dunnett’s multiple comparison test and are indicated by rhombs (#p<0.05, ##p< 0.01, ###p<0.001), while differences between free and liposomal curcumin are analyzed by Two-Way-ANOVA followed by Bonferroni’s multiple comparison test and marked by asterisks (**p<0.01).
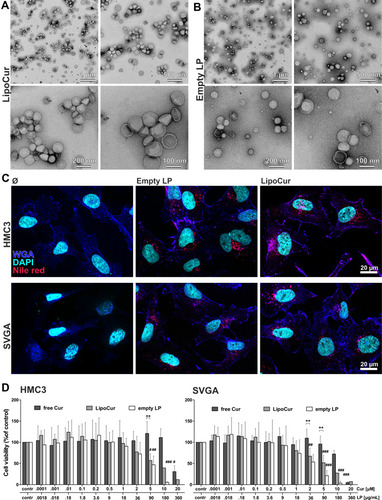
Figure 4 Effects of liposomal and free curcumin on experimental models of neuroinflammation (A, B) and reactive gliosis (C, D). (A) Upon stimulation with 100 ng/mL LPS for 24 h, HMC3 cells showed the typical amoeboid morphology of reactive microglia, which could be alleviated by pre-incubation with 0.01 µM free (Cur) or liposomal curcumin (LipoCur). Representative images of n = 2 independent stimulations, scale bar indicate 20 µm. (B) Stimulation with 100 ng/mL LPS for 24 h also induced expression of pro-inflammatory cytokines IL6, IL1β, TNFα and TGFβ, as monitored by qPCR. These effects could be reduced by pre-incubation with 0.01 µM curcumin and, in trend even more effective, by corresponding amounts of LipoCur. Please note that due to high variations of LPS-induced cytokine expression curcumin and LipoCur mediated reduction is not always significant, but trends can be seen for all investigated cytokines. Graphs show ΔΔCT values representing the n-fold expression in comparison to unstimulated controls. In non-inflammatory conditions (without LPS stimulation), neither curcumin, nor LipoCur, nor empty liposomes induced any changes in expression of these genes. (C) Stimulation with a combination of IL1β, TNFα and TGFβ (10 ng/mL each) for 24 h served to induce activation of human astrocyte cell line SVGA. Cells show nuclear deformations as a sign of cellular stress. Effects were almost completely abolished upon pre-incubation with 0.01 µM free curcumin or LipoCur. Representative images from n = 2 experiments, scale bar indicates 20 µm. (D) As representatives for reactive astrogliosis associated genes, expression of nestin, tenascin C and fibronectin was analyzed by qPCR and found to be induced upon stimulation with IL1β, TNFα and TGFβ (10ng/mL each) for 24 h. These effects were significantly alleviated by pre-incubation with 0.01 µM curcumin or LipoCur. LipoCur showed higher significance levels compared to soluble curcumin and was in case of tenascin C even significantly more effective. In “normal” conditions (without cytokine stimulation), neither curcumin, nor LipoCur, nor empty liposomes induced any changes in expression of these genes. Shown are mean values ± SD from n = 5–15 independent experiments, asterisks indicate significant changes of stimulations compared to LPS control (B) and cytokines (D) or between the groups under the brackets. Data have been analyzed by Two-Way-ANOVA followed by Bonferroni’s multiple comparison test (*p<0.05, **p<0.001, ***p<0.001, ****p<0.0001).
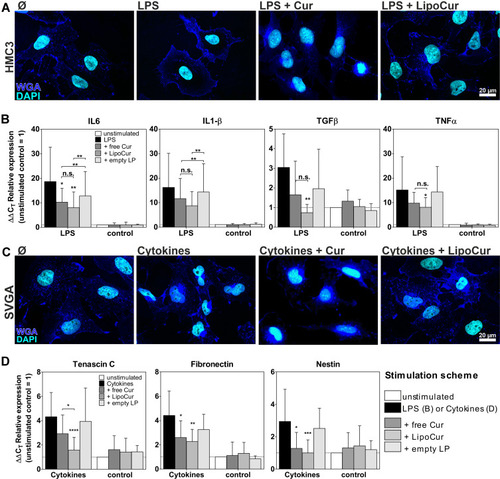
Figure 5 Effects of liposomal and free curcumin on LPS-challenged organotypic brain slices, regarding cytotoxicity (A) and alteration of mRNA expression of pro-inflammatory cytokines (B). (A) Murine acute brain slices were treated with 100 µg/mL LPS with or without pre-incubation with 0.01 µM free curcumin or LipoCur for 8 days, and cytotoxicity was measured from supernatants after 2 and 8 div by Cytotoxicity assay. LPS stimulation induced cytotoxicity (black bar) was completely abolished (compare unstimulated control: white bar) by simultaneous stimulation with LipoCur or free Cur, but not by empty liposomes (empty LP, grey bars). Neither curcumin nor LipoCur nor empty LP had significant effects on cytotoxicity in single stimulations (without LPS, grey bars). Measured extinctions were normalized to unstimulated control (=1), and mean values of 3 respective5 independent experiments (± SD) are shown for cytotoxic effects after2 div respective 8 div. Asterisks indicate significant changes to LPS-stimulated slices (*p<0.05, **p<0.001, ***p<0.001), analyzed by Two-Way-ANOVA followed by Bonferroni’s multiple comparison test. (B) Analyses of effects of LipoCur and free Cur on the expression of cytokines revealed that both could at least in trend reduce LPS-induced upregulation of inflammatory genes IL1β, IL6, and TNFα. TGFβ was not induced by LPS at 8 div, and consequently not affected by LipoCur or free Cur. Graphs show mean ΔΔCT values ± SD representing the n-fold expression in comparison to unstimulated controls. Data have been analyzed for statistical significance by Two-Way-ANOVA followed by Bonferroni’s multiple comparison test. Asterisks indicate significant changes to LPS-stimulated slices or between stimulations (*p<0.05, **p<0.001, ***p<0.001).
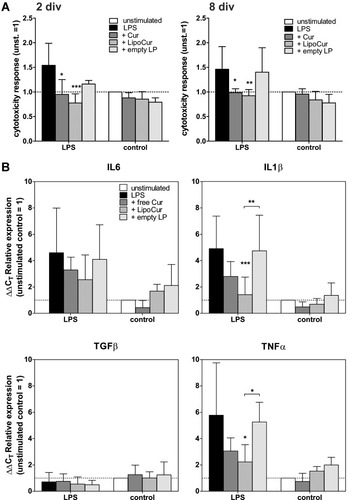
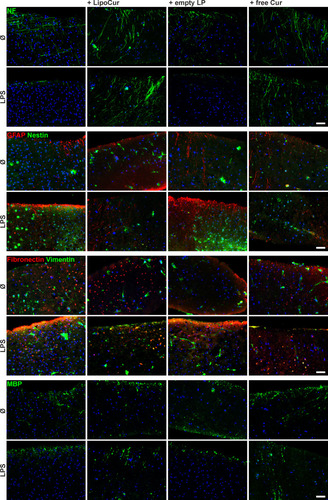
Figure 6 Effects of liposomal (LipoCur) and free Curcumin on LPS-challenged organotypic brain slice morphology. Murine acute brain slices were treated with 100 µg/mL LPS with or without 0.01 µM free curcumin or LipoCur for 8 days, slices were cut in 10 µm cryosections and immunostained with antibodies against neurofilament-M (NF, neurons), GFAP and nestin (astrocytes, glial precursors, reactive astrocytes), fibronectin and vimentin (reactive astrocytes, glial scarring), as well as MBP (oligodendrocytes). These exemplary pictures of n = 4 individual experiments show that LipoCur and free curcumin (but not empty liposomes) can effectively restore LPS-mediated loss of neurofilament and attenuate induction of reactive gliosis associated markers like GFAP, nestin, fibronectin and vimentin. Oligodendrocytes marked by MBP staining, however, were hardly affected by LPS stimulation and co-stimulation with LipoCur or free curcumin. Scale Bars indicate 50 µm, please refer to Figure S1 for secondary antibody controls.