Figures & data
Figure 1 Scanning electron micrograph of an isolate from peripheral blood of a healthy human donor (male, 28 years). A mass of microparticles and numerous residual erythrocytes can be seen. The image was taken using a Quanta TM 250 FEG (FEI, Hillsboro, OR) scanning electron microscope at FEI Quanta, Eindhoven, The Netherlands, by applying 1.5 kV.
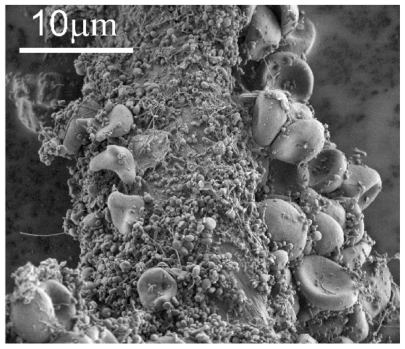
Figure 2 Scanning electron micrograph of chosen regions of an isolate from peripheral blood of a healthy human donor (male, 28 years). In addition to numerous nanoparticles which are present in all the pictures, erythrocytes (A – black arrow, B), activated platelets (A – white arrow), tubules (C), tori (E – white arrows), starfish (F – black arrow) and a deformed erythrocyte exhibiting protrusion with a bulbous end (F – white arrow) were observed. (A – D) images taken using a LEO Gemini 1530 (LEO, Oberkochen, Germany) scanning electron microscope by applying 8 kV (A, C, and D) and 2.7 kV (B), at Åbo Akademi University, Åbo/Turku. Images E and F taken by Quanta TM 250 FEG (FEI, Hillsboro, Oregon, OR) scanning electron microscope at FEI Quanta, Eindhoven, The Netherlands, by applying 1.5 kV.
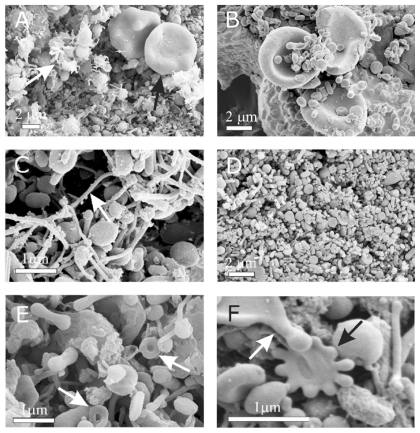
Figure 3 Representative characteristic shapes of nanoparticles found in an isolate from the blood of a patient with pancreatic cancer (female, 60 years). Shapes include shizocytes (A and B), dumbbell (C), submicron discocyte (D), and the corresponding shapes calculated by minimization of the membrane free energy (E and F). The shape in panel E was obtained for a relative volume v = 36 π V2/3/A3/2 = 0.65, where V is the volume of the vesicle, A is the surface area of the vesicle and for the relative average mean curvature <h> = 1/2A ∫(C1 + C2)dA = 1.32, where C1 and C2 are the two principal curvatures at a chosen point of the membrane surface and integration is performed over the entire surface of the vesicle A. For the shape in panel F, v = 0.55 and <h> = 1.055. Intrinsic principal curvatures were equal to 0 for both shapes. The images were taken using a LEO Gemini 1530 (LEO, Oberkochen, Germany) scanning electron microscope by applying 8 kV at Åbo Akademi University, Åbo/Turku, Finland.
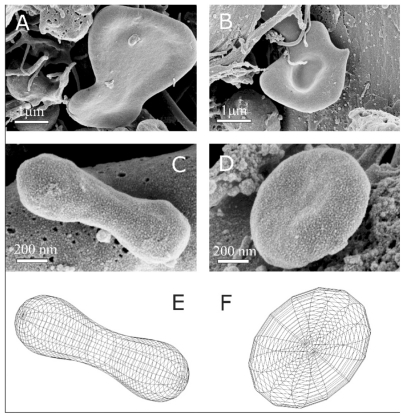
Table 1 Size (diameter) of nanoparticles isolated from the same human blood sample as observed by two different scanning electron microscopes
Figure 4 Deformation of cell-derived material obtained by isolation procedure. Deformed cells from the blood of a healthy mare (aged five years) exhibit protrusions connected by thin necks, which were torn eventually to yield membrane-enclosed cell fragments (A). Close to the tube wall, the shear forces in the centrifuge are high and therefore the cell fragments in the isolate from the blood of a healthy human donor (male, 28 years) are elongated and exhibit preferential orientation (B). The images were taken using a LEO Gemini 1530 (LEO, Oberkochen, Germany) scanning electron microscope by applying 8 kV at Åbo Akademi University, Åbo/Turku, Finland.
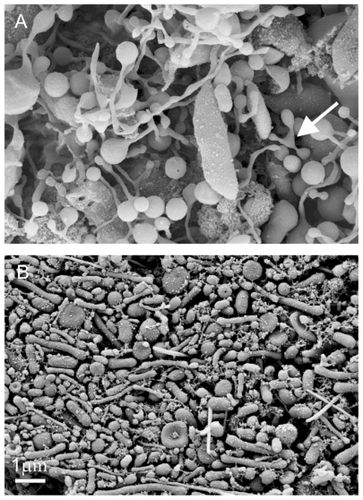
Table 2 Concentration of nanoparticles obtained by isolating nanoparticles from blood of 42 donors with no record of disease, at different temperatures
Table 3 Concentration of nanoparticles isolated from human blood at different temperatures and time of blood sampling for seven subjects
Table 4 Mean of the parameter representing flow cytometric measurement of light scattering in the forward direction (relative units) at different temperatures
Table 5 Size of nanoparticles isolated from mare’s blood at different temperatures (diameter measured from scanning electron microscope images taken at Åbo Akademi University, Åbo/Turku, Finland)
Figure 5 Platelets and nanoparticles at different temperatures. Nanoparticles were isolated from platelet-rich plasma of a healthy human donor (female, 28 years) at different temperatures (A: 4°C, B: 20°C, C: 37°C), platelets from platelet-rich plasma of a mare (D: 4°C, E: 20°C, F: 37°C), nanoparticles isolated from blood of the mare (G: 4°C, H: 20°C, I: 37°C). The images were taken using a LEO Gemini 1530 (LEO, Oberkochen, Germany) scanning electron microscope by applying 8 kV at Åbo Akademi University, Åbo/Turku, Finland.

Figure 6 Budding of membranes. (A) Budding of erythrocytes induced by adding detergent to the suspension of erythrocytes (scanning electron microscopy performed at Åbo Akademi University, Åbo/Turku, Finland). (B) A budding erythrocyte found in an isolate from human blood with numerous nanoparticles (scanning electron microscopy performed at FEI Quanta, Eindhoven, The Netherlands). (C) Nanoparticles isolated from suspension of erythrocytes with added detergent. (D) Precursors of nanoparticles appearing at the top of the echinocyte spicules. (A, C, and D images taken using a LEO Gemini 1530 (LEO, Oberkochen, Germany) scanning electron microscope by applying 8 kV, at Åbo Akademi University, Åbo/Turku, Finland. Image (C) taken by Quanta TM 250 FEG (FEI, Hillsboro, OR) scanning electron microscope at FEI Quanta, Eindhoven, The Netherlands, by applying 1.5 kV). Image in Panel B was taken from Šuštar et al.Citation46
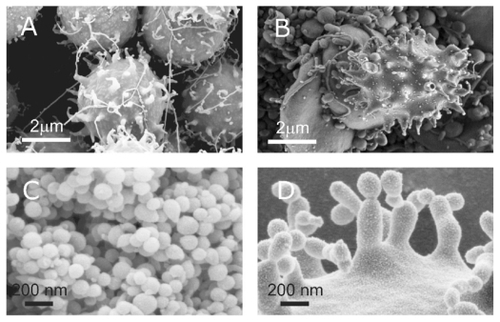
Table 6 Correlation between nanoparticle concentration in isolate and platelet concentration in blood in six experiments involving healthy human donors