Figures & data
Table 1 Physicochemical properties of unlabeled and rhodamine-labeled nanoparticles
Figure 1 Transmission electron microscopic images of (A) PLGA/CS nanoparticles, (B) PLGA/PVA nanoparticles, and (C) PLGA/PF68 nanoparticles.
Abbreviations: PLGA, poly (lactide-co-glycolide); PVA, poly (vinyl alcohol); PF68, Pluronic® F68; CS chitosan.
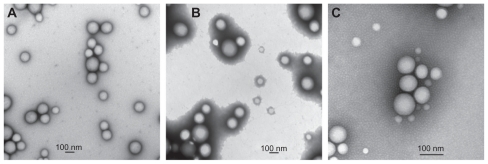
Table 2 Evolution of mean diameter of PLGA/CS, PLGA/PVA, and PLGA/PF68 nanoparticles at 37°C as a function of time (size is expressed in nm unless otherwise stated). Nanoparticles were incubated and measured in water, cell culture medium containing 10% fetal bovine serum, and Ca2+ and Mg2+ free phosphate buffer
Figure 2 Calu-3 cell viability (MTT assay) after 72 hours of exposure to PLGA/CS, PLGA/PVA, and PLGA/PF68 nanoparticles (0.030–5 mg/mL). Each experiment was repeated eight times from three independent incubation preparations. Results are expressed as percentages of absorption for treated cells (± standard deviation) in comparison with untreated control cells.
Notes: Statistical significance was indicated as P < 0.05. *PLGA/CS nanoparticles versus PLGA/PVA nanoparticles (0.030–5 mg/mL); **PLGA/CS versus PLGA/PF68 nanoparticles (3–5 mg/mL); §PLGA/PVA nanoparticles versus PLGA/PF68 nanoparticles (0.030–1 mg/mL).
Abbreviations: PLGA, poly (lactide-co-glycolide); PVA, poly (vinyl alcohol); CS, chitosan; NPs, nanoparticles; PF68, Pluronic® F68.

Figure 3 Calu-3 cell viability (MTT assay) after 72 hours of exposure to (A) PLGA/CS, (B) PLGA/PVA, and (C) PLGA/PF68 nanoparticles or (A) CS, (B) PVA, and (C) PF68 solutions as a function of stabilizer concentration. Each experiment was repeated eight times from three independent incubation preparations. Results are expressed as percentages of absorption for treated cells (± standard deviation) in comparison with untreated control cells.
Note: Statistical significance was indicated as *P < 0.05 (stabilizer solution versus PLGA nanoparticles).
Abbreviations: PLGA, poly (lactide-co-glycolide); PVA, poly (vinyl alcohol); PF68, Pluronic® F68; CS, chitosan; NPs, nanoparticles.
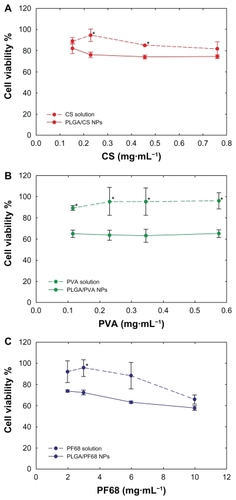
Figure 4 Evolution of Calu-3 cell viability (MTT assay) after exposure to (A) PLGA/CS, (B) PLGA/PVA, and (C) PLGA/PF68 nanoparticles as a function of time. Each experiment was repeated eight times from three independent incubation preparations. Results are expressed as percentages of absorption for treated cells (± standard deviation) in comparison with untreated control cells.
Notes: The significance was indicated as *P < 0.05 (24 hours versus 4 hours) and #P < 0.05 (72 hours versus 24 hours).
Abbreviations: PLGA, poly (lactide-co-glycolide); PVA, poly (vinyl alcohol); PF68, Pluronic® F68; CS, chitosan; NPs, nanoparticles.
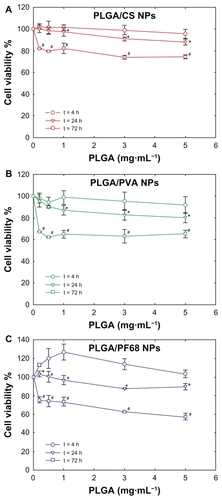
Figure 5 Real time confocal laser scanner microscopy images of Calu-3 cells exposed to Rhod-PLGA/PVA nanoparticles for 24 hours and subsequent washing of the medium. (A) Nomarski image, (B) fluorescent image, and (C) superimposition of Nomarski and fluorescence images, and (D) enlarged region of (C).
Note: Scale bars = 20 μm.
Abbreviations: PLGA, poly (lactide-co-glycolide); PVA, poly (vinyl alcohol); Rhod, rhodamine B alcohol.
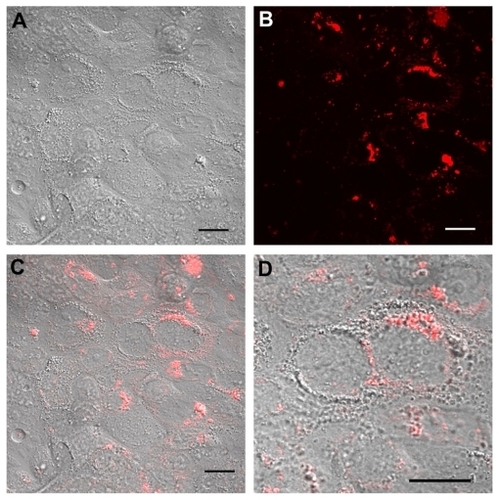
Figure 6 (A) IL-6 and (B) IL-8 secretion by Calu-3 cells exposed for 24 hours and 48 hours to lipopolysaccharide (gray bars), PLGA/CS (red bars), PLGA/PVA (green bars), and PLGA/PF68 nanoparticles (blue bars). White bars represent cytokine secretion from untreated control cells.
Notes: Data represent the mean ± standard deviation (n = 3). *P < 0.05, **P < 0.01 (lipopolysaccharide-exposed versus control and nanoparticle-treated cells).
Abbreviations: PLGA, poly (lactide-co-glycolide); PVA, poly (vinyl alcohol); PF68, Pluronic® F68; CS, chitosan; IL, interleukin.
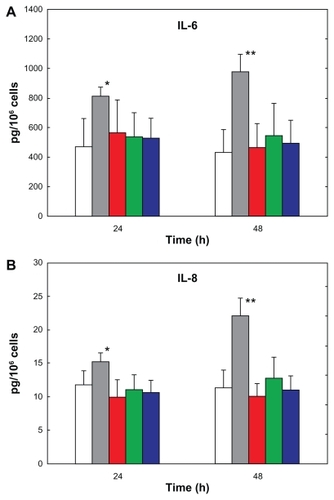
Table S1 X-ray photoelectron spectroscopic analysis of the different C1s and O1s peak fitting intensities of the polymers before and after particle formulation
Table S2 Fluorescence variation with Calu-3 cells after exposure to Rhod-PLGA/CS, Rhod-PLGA/PVA, and Rhod-PLGA/PF68 nanoparticles. Red fluorescence was measured at 4, 12, and 24 hours
Figure S1 Oxygen O1 s envelopes of x-ray photon spectroscopic analysis from (A) PLGA/CS nanoparticles and (B) Rhod-PLGA/CS nanoparticles.
Abbreviations: Rhod, rhodamine B; PLGA, poly (lactide-co-glycolide); CS, chitosan.
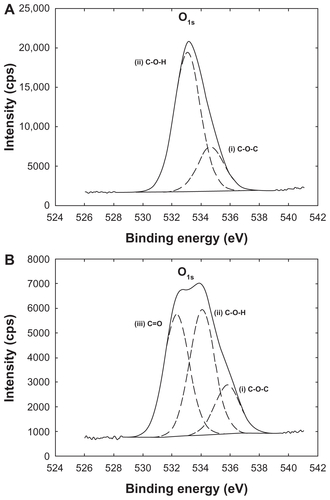
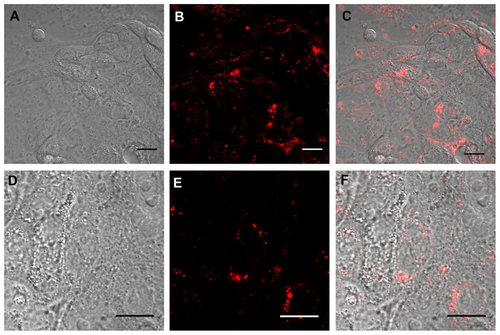
Figure S2 Real time confocal laser scanner microscopy images of Calu-3 cells exposed to Rhod-PLGA/CS nanoparticles for 24 hours and subsequent washing of the medium. (A) Nomarski image, (B) fluorescent image, and (C) superimposition of Nomarski and fluorescence images. (D, E, and F) show enlarged pictures.
Note: Scale bars = 20 μm.
Abbreviations: Rhod, rhodamine B; PLGA, poly (lactide-co-glycolide); CS, chitosan.
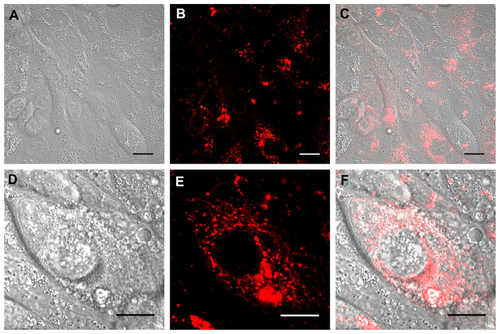
Figure S3 Real time confocal laser scanner microscopy images of Calu-3 cells exposed to Rhod-PLGA/PF68 nanoparticles for 24 hours and subsequent washing of the medium. (A) Nomarski image, (B) fluorescent image, and (C) superimposition of Normaski and fluorescence images. (D, E, and F) show enlarged pictures.
Note: Scale bars = 20 μm.
Abbreviations: Rhod, rhodamine B; PLGA, poly (lactide-co-glycolide); PF68, Pluronic® F68.