Figures & data
Figure 1 Schematic illustration of the fabrication process of the nanostructured gold surface: citrate protected gold nanoparticles are electrostatically immobilized to a self-assembled monolayer of cysteamine. After washing in basic piranha solution, the particles are integrated with the gold substrate and the cysteamine is desorbed, leaving a clean gold surface.
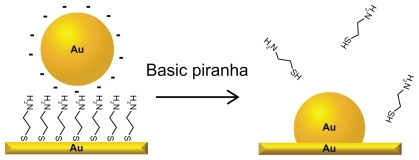
Figure 2 Scanning electron microscopy images showing a smooth area on a nanostructured gold surface, created by scratching away the particles with a syringe needle. The dark line represents the smooth area. The difference in surface roughness is clearly seen in the magnified inset. done with the software of the instrument, using a Tougaard background and tabulated sensitivity factors.
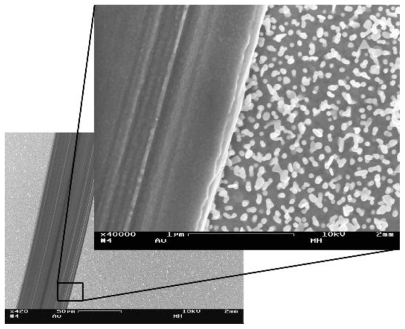
Figure 3 Scanning electron microscopy images of gold nanoparticles bound to the smooth gold background. (A) Particles bound to the surface by electrostatic interaction with a self-assembled monolayer of cysteamine. (B) After washing in basic piranha the particles are integrated with the background surface. Magnification: 100,000×.
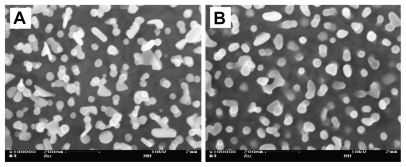
Table 1 Physicochemical properties of smooth and nanostructured surfaces used in the experiments
Figure 4 Overlay of X-ray photoemission spectroscopy survey spectra from nanostructured (solid line) and smooth (dotted line) surfaces, showing essentially similar chemical fingerprints.
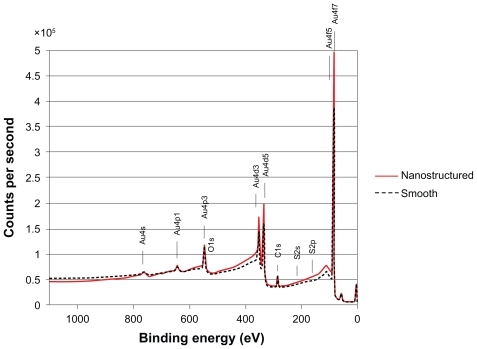
Figure 5 Fluorescence microscopy images of FITC-labeled antibodies binding to C3c in serum adsorbed to the nanostructured surfaces visualized in . (A) The increased fluorescence from the smooth area of the surface is seen as a bright line. (B) Negative control using heat inactivated serum.
Abbreviation: FITC, fluorescein isothiocyanate.
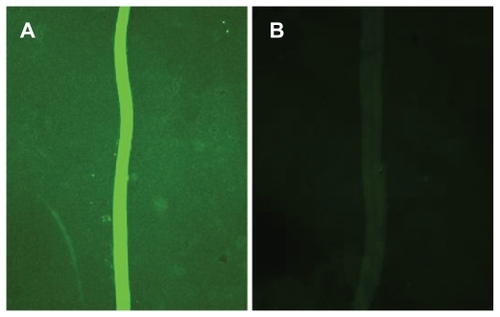
Figure 6 (A) QCM-D measurements of the mass adsorption of serum proteins on smooth and nanostructured surfaces. (B) Activation of the immune complement measured in QCM-D as the amount of binding anti-C3c antibodies to serum adsorbed on smooth or nanostructured gold surfaces. Positive controls with immunoglobulin G and cysteamine, and the negative control (heat-inactivated serum) are also shown.
Notes: Error bars represent standard deviations; N ≥ 5.
Abbreviation: QCM-D, quartz crystal microbalance with dissipation monitoring.
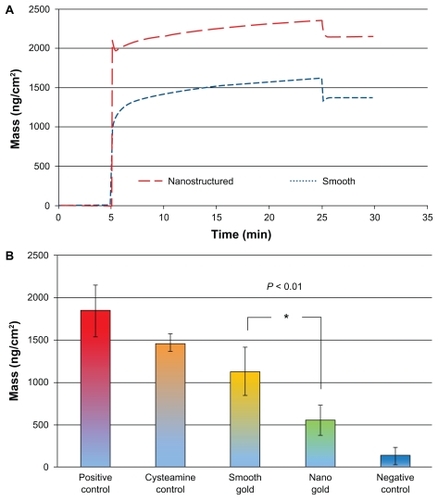
Figure 7 Adsorption of human IgG and the corresponding activation of the immune complement in human serum measured with QCM-D on hydrophilic surfaces. Smooth surfaces are shown to the left, and nanostructured surfaces to the right.
Notes: Error bars represent standard deviation; N ≥ 5.
Abbreviations: IgG, immunoglobulin G; QCM-D, quartz crystal microbalance with dissipation monitoring.
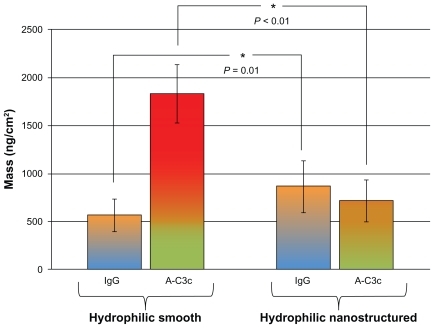
Figure 8 Adsorption of human IgG and the corresponding activation of the immune complement in human serum measured with QCM-D on hydrophobic surfaces. Smooth surfaces are shown to the left, and nanostructured surfaces to the right.
Note: Error bars represent standard deviation; N ≥ 5.
Abbreviations: IgG, immunoglobulin G; QCM-D, quartz crystal microbalance with dissipation monitoring.
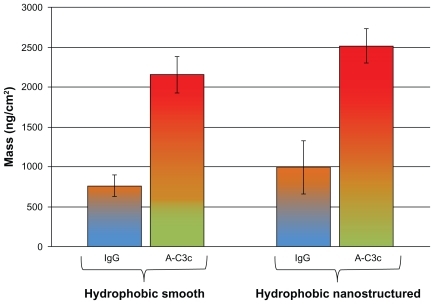
Figure 9 Illustration of how the curvature of a 60 nm particle affects the distance between adsorbed proteins. In this example, the distance between the C1q binding hinge region of immunoglobulin G molecules are clearly increased by the curvature. (Image drawn according to scale.)
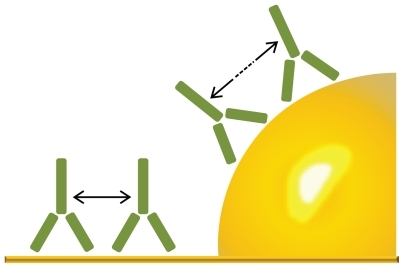
Figure S1 Positive secondary ion mass spectra from (A) cysteamine, nonwashed gold surface, (B) flat gold surface, (C) nanostructured gold surface, and (D) scratched area on nanostructured surface.
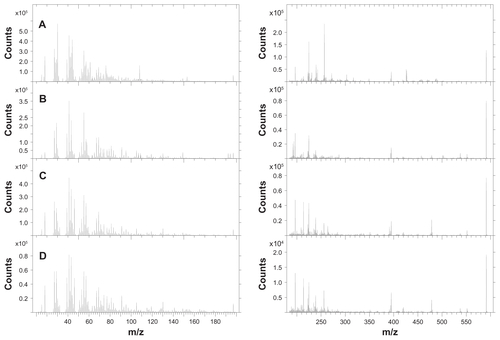
Figure S2 Negative secondary ion mass spectra from (A) cysteamine, nonwashed gold surface, (B) flat gold surface, (C) nanostructured gold surface, and (D) scratched area on nanostructured surface.
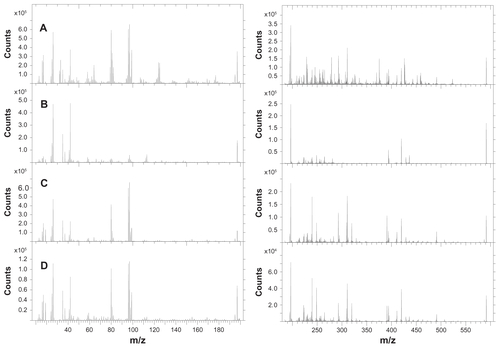
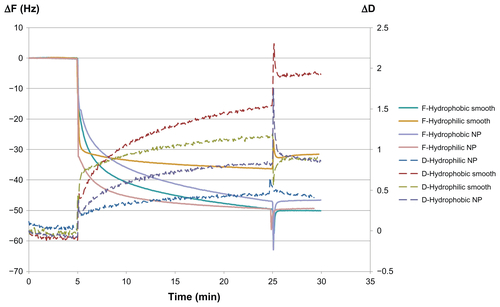
Figure S3 Representative QCM-D graph showing ΔF and ΔD for the adsorption of human IgG (100 μg/mL) for 20 minutes on hydrophilic and hydrophobic smooth and nanostructured gold surfaces. After 5 minutes of baseline with carrier buffer, IgG was introduced. After 20 minutes of adsorption of the protein, a 5-minute rinse with carrier buffer was performed. Note the ΔD when both nanostructured and smooth surfaces are hydrophobized, interpreted here as a higher degree of denaturation of the adsorbed protein.
Abbreviations: ΔF, change in resonance frequency; ΔD, change in dissipation; IgG, immunoglobulin G; NP, nanoparticle; QCM-D, quartz crystal microbalance with dissipation monitoring.