Figures & data
Figure 1 TEM images comparing chrysotile asbestos aggregate (a) with a MWCNT aggregate collected above a natural gas kitchen burner (b). The arrows in (a) and (b) illustrate the essentially identical nanotube structure and dimensions.
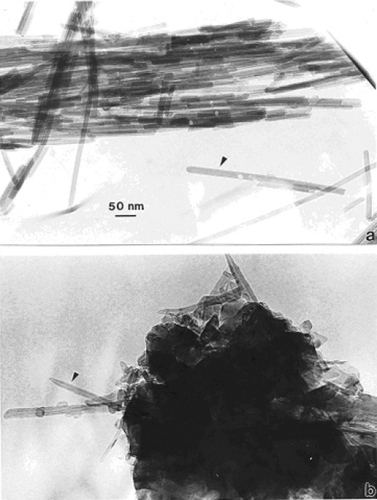
Figure 2 TEM image of commercial, arc-evaporation-produced MWCNT-R aggregate material for comparison with .
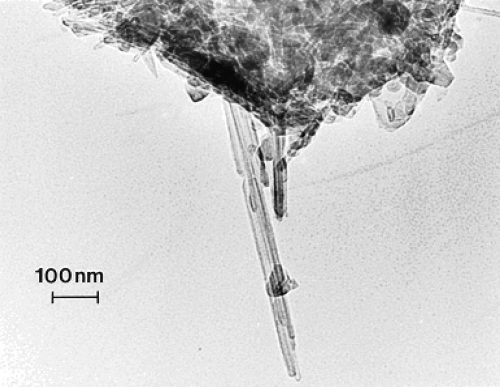
Figure 3 Examples of tire soot nanostructure. (a) TEM image and SAED pattern insert for a portion of a large fractal-like aggregate collected by thermal precipitation (CitationBang et al 2003) on a SiO/formvar-coated grid. (b) STEM image of an aggregate segment observed in the FESEM at 20 kV accelerating potential. (c) Corresponding SEM image of (b).
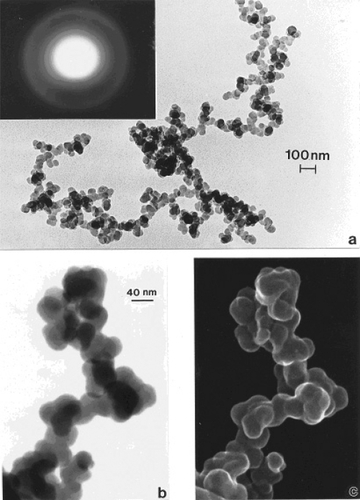
Figure 4 Wood soot examples observed in the TEM (burning douglas fir and larch PM collected on filters and scraped off onto TEM grid sandwich). (a) Large, dense aggregate with superimposed SAED pattern illustrating prominent, (but diffuse) graphite reflections. (b) smaller, fractal-like aggregate.
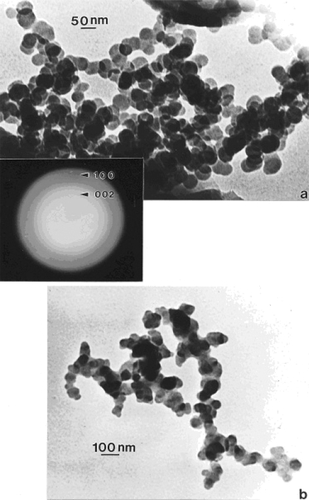
Figure 5 TEM images of soot aggregates collected by thermal precipitation in homes. (a) Candle soot. (b) Unknown soot PM collected in a kitchen.
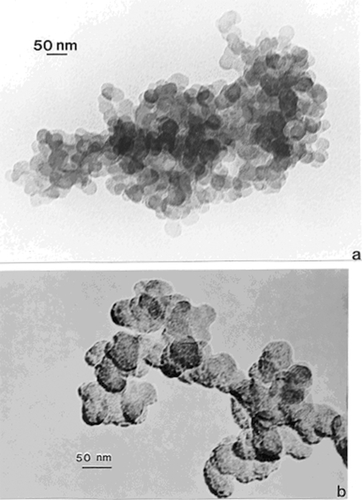
Figure 6 Direct contact, filter-collected soot PM aggregate and surrogate BC and MWCNT 48 h assays [36] compared with conventional cytotoxicity assay data (*). Data from CitationSoto and colleagues (2006, Citation2007). The relative cell viability at 48 h for A549 human epithelial (cancer) cell cultures was ascertained for filter-collected soot and for indicated materials at 5 μg/ml. The “blank” is a blank reference filter in culture. Yellow flame and blue flame soot refer to rich (oxygen depleted) natural gas combustion and efficient natural gas combustion. Data are presented as the mean ± SEM of duplicate wells and are one of three representative experiments.
![Figure 6 Direct contact, filter-collected soot PM aggregate and surrogate BC and MWCNT 48 h assays [36] compared with conventional cytotoxicity assay data (*). Data from CitationSoto and colleagues (2006, Citation2007). The relative cell viability at 48 h for A549 human epithelial (cancer) cell cultures was ascertained for filter-collected soot and for indicated materials at 5 μg/ml. The “blank” is a blank reference filter in culture. Yellow flame and blue flame soot refer to rich (oxygen depleted) natural gas combustion and efficient natural gas combustion. Data are presented as the mean ± SEM of duplicate wells and are one of three representative experiments.](/cms/asset/939c69c0-2e52-4cd5-850a-cac100dcd5ce/dijn_a_2464_f0006_b.jpg)
Figure 7 Examples of ROS generation of A549 cells. Media-treated cells and H2O2-treated cells were used as negative and positive controls, respectively and DMSO-treated cells functioned as a vehicle control. Presence of ROS was determined by the relative increase in fluorescence over time as shown. From CitationSoto and colleagues (2008). Data are presented as the mean ± SEM of quadruplicate wells and are one of three representative experiments.
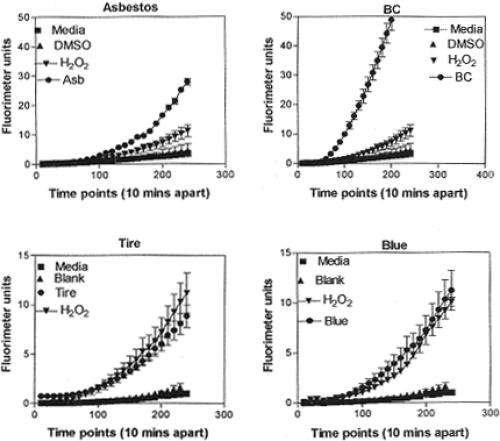
Figure 8 Summary of ROS generation and some corresponding total PAH content (data from CitationShi and colleagues (2007)) as cross-hatched and concentration noted in parentheses. Open bars show ROS generation by A549 cells 240 minutes after the addition of the DCA-DF dye following a 48 h treatment (incubation of cells with particulate matter). ROS data are presented as the mean ± SEM of quadruplicate representative experiments, after CitationSoto and colleagues (2008).
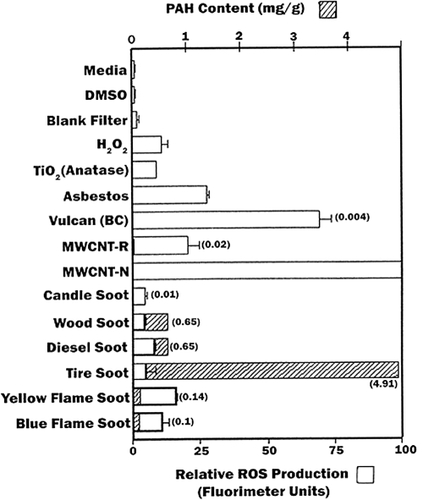
Table 1 PAH content of aggregated carbon and carbonaceous nano-PMTable Footnote*Table Footnote†
Table 2 Summary of PAH concentration in indoor air (as percent of total)
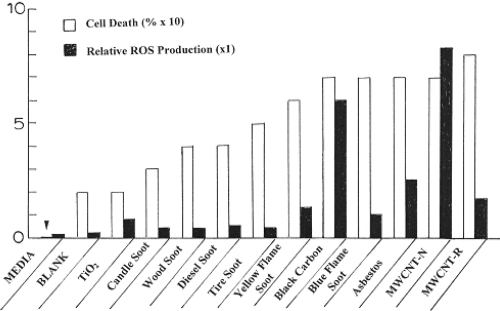
Figure 9 Comparison of cell death (percent) and relative ROS production for the nanoparticulate materials studied in this research program. The arrow at left is indicative of the media cell death reference at zero.