Figures & data
Figure 1 Transmission electron microscope image of magnetic Fe3O4 nanoparticles.
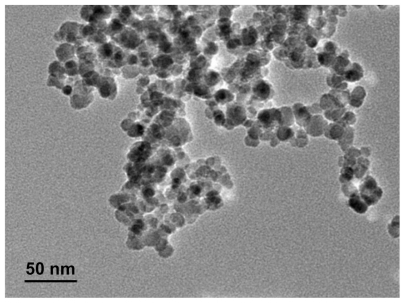
Figure 2 Size distribution histogram of magnetic Fe3O4 nanoparticles.
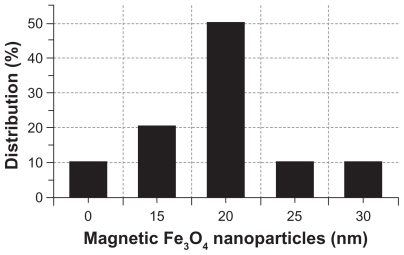
Figure 3 Cytotoxic effect of GA or GA-loaded MNP-Fe3O4 against the Capan-1 pancreatic cancer cells. Inset: Microscopic images of the Capan-1 cells after different treatments for 48 hours. (A) untreated cells as control, (B) MNP-Fe3O4, (C) GA alone, and (D) GA-loaded MNP-Fe3O4.
Notes: The concentrations of GA, MNP-Fe3O4 are 1 μmol/L and 20 μg/mL, respectively. Data are expressed as means ± standard deviations (n − 3).
Abbreviations: GA, gambogic acid; MNP-Fe3O4, magnetic Fe3O4 nanoparticles.
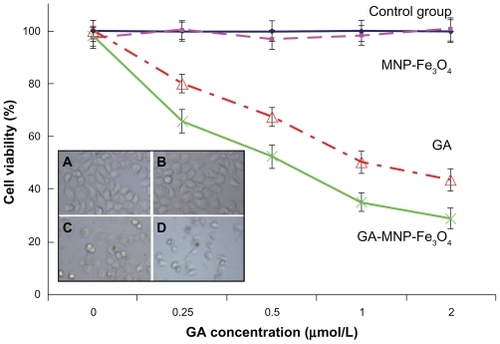
Figure 4 Nuclear morphologic changes of the Capan-1 pancreatic cancer cells after different treatment for 48 hours. (A) untreated cells as control, (B) MNP-Fe3O4, (C) GA alone, and (D) GA-loaded MNP-Fe3O4.
Notes: The concentrations of GA and MNP-Fe3O4 are 1 μmol/L and 20 μg/mL, respectively. Magnification folds ×400. Arrows indicate cells with apoptotic nuclear condensation and fragmentation.
Abbreviations: GA, gambogic acid; MNP-Fe3O4, magnetic Fe3O4 nanoparticles.
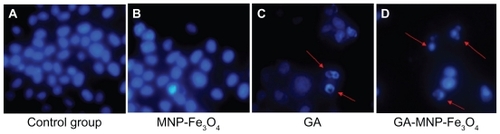
Figure 5 Expression of Bax, Bcl-2, caspase 3, and caspase 9 protein in the Capan-1 pancreatic cancer cells by Western blot after treatment of GA and/or MNP-Fe3O4 for 48 hours. Line 1, control; Line 2, incubated with 20 mg/L MNP-Fe3O4; Line 3, incubated with 1 μmol/L GA; Line 4, incubated with 1 μmol/L GA and 20 μg/mL MNP-Fe3O4.
Abbreviations: MNP-Fe3O4, magnetic nanoparticles of Fe3O4; GA, gambogic acid.
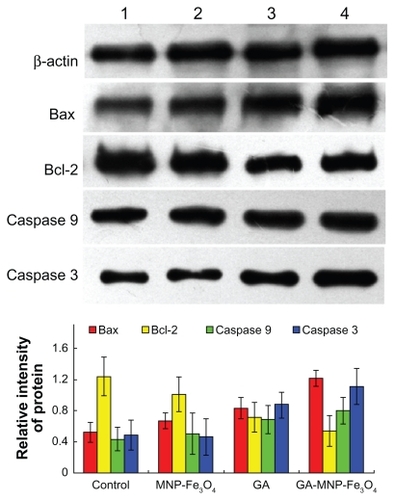
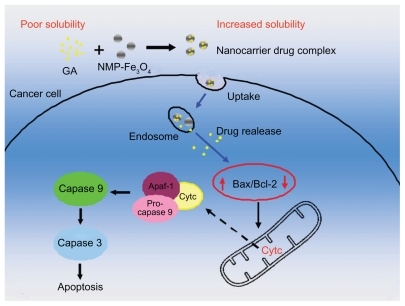
Figure 6 Schematic illustration of the possible process of distinguished improvement in anticancer activity by the GA-loaded MNP-Fe3O4.
Abbreviations: MNP-Fe3O4, magnetic nanoparticles of Fe3O4; GA, gambogic acid.