Figures & data
Figure 1 Effect of heat treatment on cytotoxicity of TRAIL to A-549 cells. Because A-549 cells are resistant to TRAIL, we added 1 μg/mL of actinomycin D to each concentration of TRAIL as a sensitizer.
Abbreviation: TRAIL, tumor necrosis factor-related apoptosis-inducing ligand.
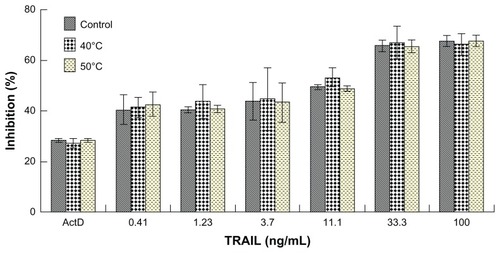
Table 1 Physical properties of the liposomal formulations
Figure 2 Transmission electron micrographs of liposomes. TRAIL liposomes (left), ActD liposomes (right).
Note: Bar = 100 nm.
Abbreviations: TRAIL, tumor necrosis factor-related apoptosis-inducing ligand; ActD, actinomycin D.
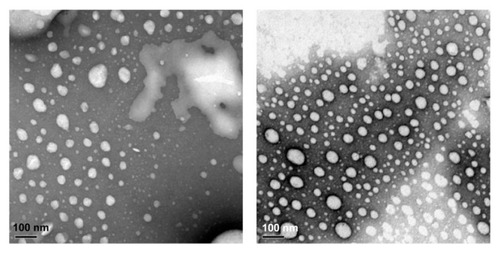
Figure 3 Induction of apoptosis in A-549 cells by TRAIL liposomes and/or ActD liposomes. (A) Bar = 250 μm. (B) Bar = 250 μm.
Abbreviations: TRAIL, tumor necrosis factor-related apoptosis-inducing ligand; ActD, actinomycin D; LPs, liposomes.
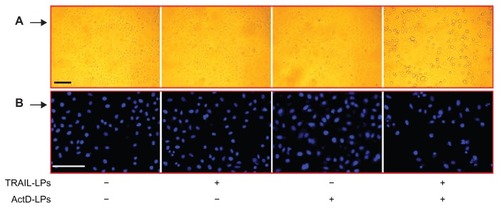
Figure 4 (A) Effect of TRAIL liposomes and/or ActD liposomes on growth inhibition of A-549 cells. (B) Cell inhibition induced by forward or reverse sequential treatment of TRAIL liposomes and ActD liposomes: 1, ActD liposome treatment for 24 hours; 2, TRAIL liposome treatment for 24 hours; 3, ActD liposome treatment for 8 hours → TRAIL liposome treatment for 16 hours; 4, TRAIL liposome treatment for 16 hours → ActD liposome treatment for 8 hours.
Note: **P < 0.01.
Abbreviations: TRAIL, tumor necrosis factor-related apoptosis-inducing ligand; ActD, actinomycin D; LPs, liposomes.
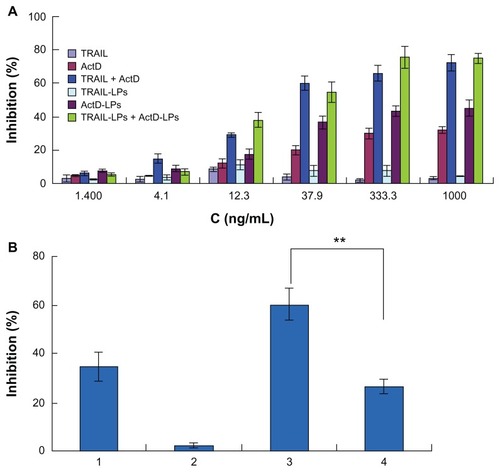
Figure 5 (A) Effects of actinomycin D liposomes on DR4 and DR5 expression. A-549 cells were treated with actinomycin D liposomes (0.125 μg/mL) for 4, 8, or 12 hours, respectively. Cell lysates were examined by Western blot. (B) Fluorescence micrographs of DR4 and DR5 expression on untreated A-549 cells. (C) Fluorescence micrographs of increased DR4 and DR5 expression on A-549 cells induced by actinomycin D liposomes.
Note: Bar = 125 μm.
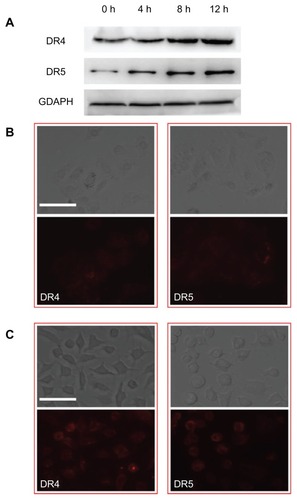
Figure 6 Qualitative assessment of apoptosis induced by TRAIL liposomes, ActD liposomes or both agents. (A) Bar = 250 μm. (B) Bar = 250 μm.
Abbreviations: TRAIL, tumor necrosis factor-related apoptosis-inducing ligand; ActD, actinomycin D; LPs, liposomes.
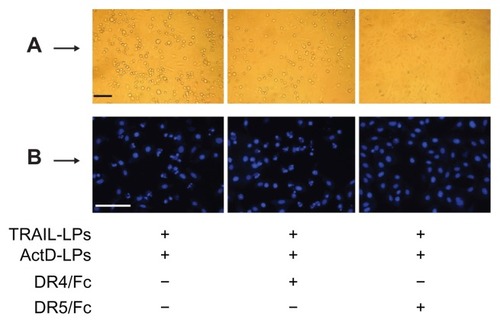
Figure 7 ActD liposomes enhance TRAIL liposome-induced cell inhibition through upregulation of DR5. A-549 cells were treated with ActD liposomes (1 μg/mL) and TRAIL liposomes (100 ng/mL) in the presence or absence of DR4/Fc chimera (1000 ng/mL) or DR5/Fc chimera (1000 ng/mL).
Notes: **P < 0.01. Cell inhibition was tested using the MTT assay.
Abbreviations: TRAIL, tumor necrosis factor-related apoptosis-inducing ligand; ActD, actinomycin D; LPs, liposomes.
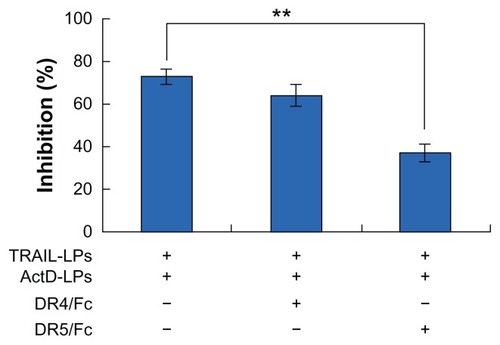
Figure 8 Effects of ActD liposomes or/and TRAIL liposomes on caspase activation. A-549 cells were treated with ActD liposomes (1 μg/mL) and/or TRAIL liposomes (100 ng/mL) for 12 hours.
Abbreviations: TRAIL, tumor necrosis factor-related apoptosis-inducing ligand; ActD, actinomycin D; LPs, liposomes.
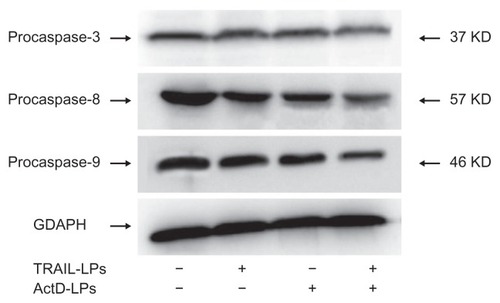
Table 2 Final tumor weight (mg) of each mouse treated with different formulations
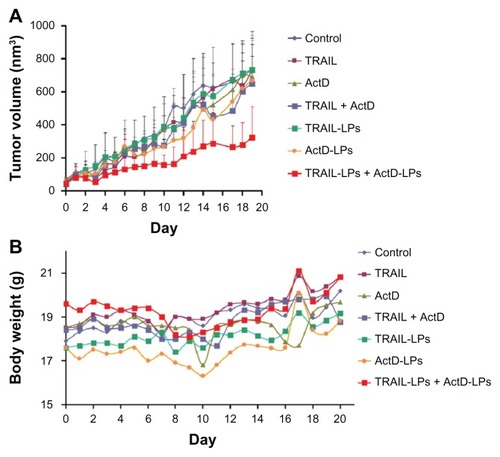
Figure 9 (A) In vivo anticancer efficacy of different treatments in A-549 tumor xenografts and (B) change in body weight as a function of time in subcutaneous A-549 xenograft-bearing mice.
Abbreviations: TRAIL, tumor necrosis factor-related apoptosis-inducing ligand; ActD, actinomycin D; LPs, liposomes.