Figures & data
Figure 1 Uptake of BBR and BBR-NLCs into RAW264.7 and Caco-2 cells was evaluated for 0.5, 1, and 2 h.
Notes: Flow cytometry was used to quantify the fluorescence intensity. For all experiments, n = 3.
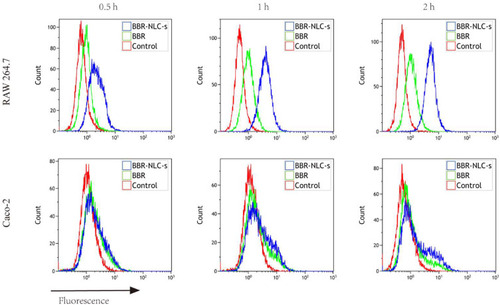
Table 1 Quantitative Real-Time PCR Primer Sequence
Table 2 Summary of Characterization of BBR-NLCs
Figure 2 Characterization of BBR-NLCs.
Note: (A) AFM image and (B) size distribution.
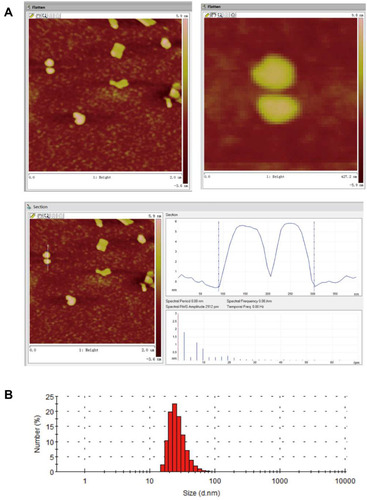
Figure 3 Dissolution profiles of BBR and BBR-NLCs.
Note: (A) In simulated gastric juice; (B) in simulated intestinal juice.
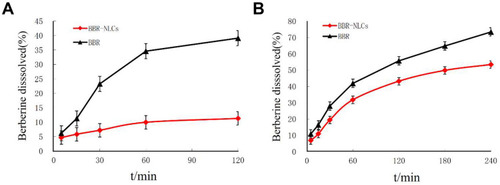
Figure 4 Hematoxylin and eosin staining of histological sections were used to assess the toxicity of BBR-NLCs toward major organs (heart, liver, spleen, lung, and kidney).
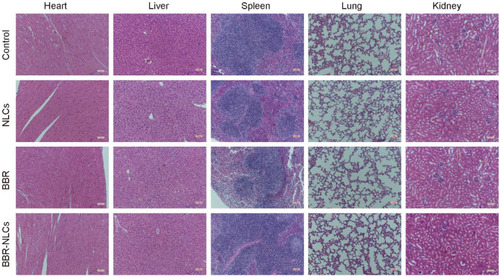
Figure 5 Uptake of berberine (BBR) and BBR-NLCs into RAW264.7 and Caco-2 cells were evaluated for 0.5 (A, B, G, H), 1 (C, D, I, J), and 2 h (E, F, K, L).
Notes: The cell outline in each plane was determined using bright field imaging. BBR fluoresces (green channel), which allowed for tracking without modification of the drug. For all experiments, n = 3, and the scale bar = 100 µm.
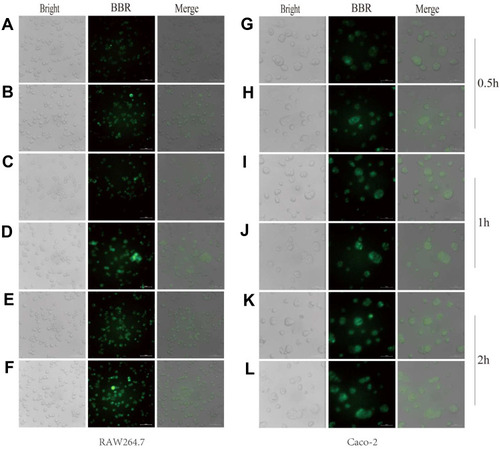
Figure 6 Treatment with BBR-NLCs alleviated symptoms of DSS-induced experimental colitis in mice.
Notes: (A) Experimental protocol for DSS-induced colitis in mice. (B) Determination of DAI. (C) Representative colon length in each group. (D) Statistical analysis of colon length. (E) Colon MPO activity. (F) Heart weight index. (G) Liver weight index. (H) Kidney weight index. (I) Lung weight index. (J) Spleen weight index. Data are presented as mean ± SD (n = 6). #P < 0.05, ##P < 0.01, ###P < 0.001 compared with the control group; *p < 0.05, **p < 0.01, ***p < 0.001 compared with the DSS group.
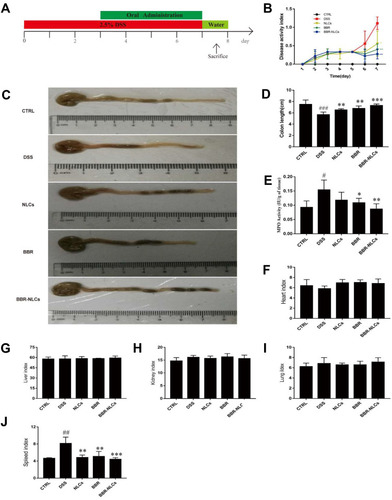
Figure 7 Representative colon tissue sections stained with hematoxylin and eosin visualized using a microscope.
Notes: (A) control; (B) DSS; (C) NLCs; (D) BBR; (E) BBR-NLCs. (F) Colitis histological score for each group. The scale bar = 1000 µm. Data are expressed as mean ± SD (n = 6). ###P < 0.001 compared with the control group; **p < 0.01, ***p < 0.001 compared with the DSS group.
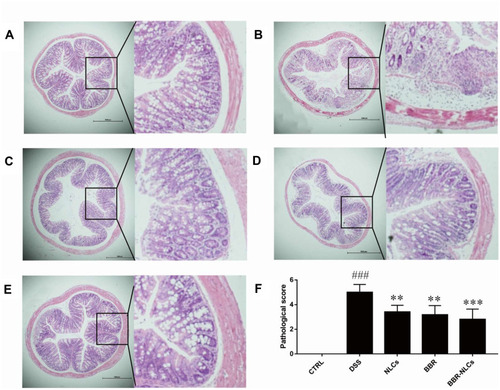
Figure 8 Representative images of ZO-1 immunofluorescence.
Notes: (A) Control; (B) DSS; (C) NLCs; (D) BBR; (E) BBR-NLCs. The tight junction protein ZO-1 was stained red, and nuclei were counterstained blue. The scale bar = 200 µm.
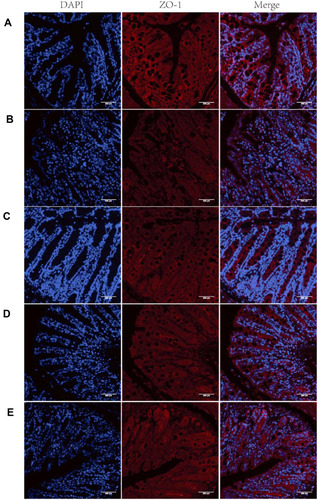
Figure 9 Suppression of mRNA expression of pro-inflammatory mediators in colon tissues in response to BBR and BBR-NLCs in mice with DSS-induced colitis in mice.
Notes: (A) IL-1β; (B) IL-6; (C) MMP-9; (D) CX3CR1; (E) COX-2; and (E) TERT. Data are expressed as mean ± SD (n = 6). #P<0.05, ##P<0.01, ###P < 0.001 compared with the control group; *p < 0.05, **p < 0.01 compared the DSS group.
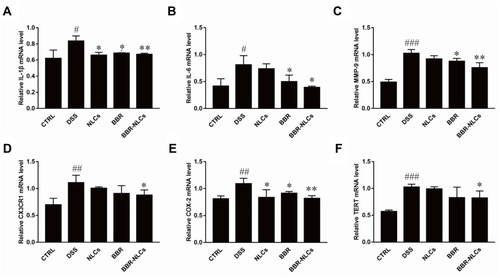
Figure 10 Berberine (BBR)-NLCs blocked LPS-induced NF-κB nuclear translocation.
Notes: (A) Untreated RAW264.7 cells. (B) RAW264.7 cells treated with LPS (100 ng/mL) for 6 h. (C) RAW264.7 cells pretreated with BBR (5 μg/mL) for 2 h, then treated with LPS (100 ng/mL) for 6 h. (D) RAW264.7 cells pretreated with BBR-NLCs (5 μg/mL) for 2 h, then treated with LPS (100 ng/mL) for 6 h. The translocation of NF-κB was determined using immunofluorescence. For all experiments, n = 3, and the scale bar = 20 µm.
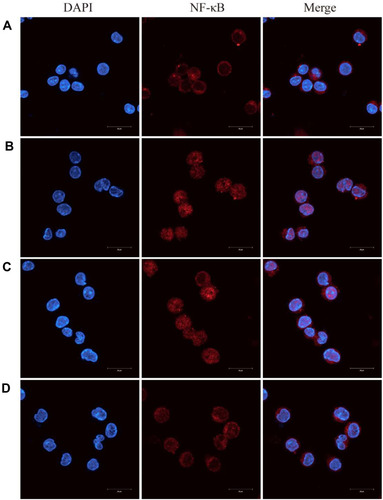
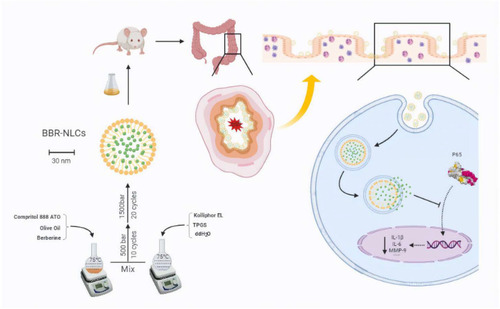
Figure 11 Schematic of preparation and functional mechanisms of BBR-NLCs.
Note: Image produced using BioRender.