Figures & data
Table 1 Formation of silica nanoparticles under conditions (1), (2), and (3) which involved stirring for 3 days at room temperature (25°C)
Figure 1 Schematic diagram of the preparation of nanoparticles-(fluorescein isothiocyanate)-polyethylene glycol-Folate (NPs[FITC]-PEG-Folate) particles. (A) The maleimide end of maleimide-FITC (Mal-FITC) reacts with thiol groups of 3-mercaptopropyltrimethoxysilane (MPS) to form stable thioester linkages. (B) Folate was activated with ethyl(dimethylaminopropyl) carbodiimide/N-hydroxysuccinimide and reacted with NH2-PEG-maleimide to form a reactive intermediate (maleimide-PEG-Folate), then the NPs(FITC) particles react with maleimide-PEG-Folate to produce NPs(FITC)-PEG-Folate particles.
Abbreviations: C3F8, octafluoropropane; DMSO, dimethyl sulfoxide.
![Figure 1 Schematic diagram of the preparation of nanoparticles-(fluorescein isothiocyanate)-polyethylene glycol-Folate (NPs[FITC]-PEG-Folate) particles. (A) The maleimide end of maleimide-FITC (Mal-FITC) reacts with thiol groups of 3-mercaptopropyltrimethoxysilane (MPS) to form stable thioester linkages. (B) Folate was activated with ethyl(dimethylaminopropyl) carbodiimide/N-hydroxysuccinimide and reacted with NH2-PEG-maleimide to form a reactive intermediate (maleimide-PEG-Folate), then the NPs(FITC) particles react with maleimide-PEG-Folate to produce NPs(FITC)-PEG-Folate particles.Abbreviations: C3F8, octafluoropropane; DMSO, dimethyl sulfoxide.](/cms/asset/740a9111-f4a1-4fc9-bc46-dc53b49b80d6/dijn_a_24792_f0001_c.jpg)
Figure 2 Scanning electron microscope images of silica nanoparticles using 3-mercaptopropyltrimethoxysilane as the sole silica source. Preparation conditions of the silica nanoparticles in (A), (B), and (C) correspond to conditions (1), (2) and (3) listed in . The mean diameters of the silica nanoparticles in (A), (B), and (C) are 2111 nm, 508 nm and 212 nm, respectively.
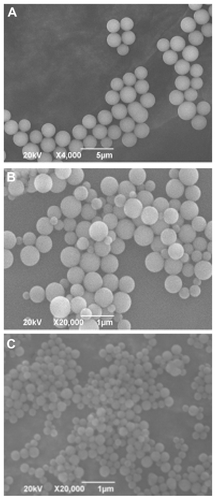
Figure 3 Fluorescence microscopy of nanoparticles-fluorescein isothiocyanate (NPs-FITC) and NPs(FITC) in solution. The sizes for the two types of particles are 212 nm (magnification 600×).
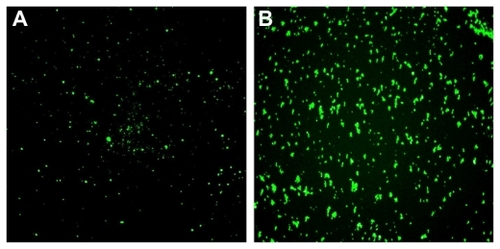
Figure 4 Fluorescence emission spectra of nanoparticles-(fluorescein isothiocyanate) (NPs[FITC]) particles (A) and NPs(FITC)-polyethylene glycol-Folate particles (B). The fluorescence excitation peak at a wavelength of approximately 440 nm indicates successful coupling of folate to particle surfaces.
![Figure 4 Fluorescence emission spectra of nanoparticles-(fluorescein isothiocyanate) (NPs[FITC]) particles (A) and NPs(FITC)-polyethylene glycol-Folate particles (B). The fluorescence excitation peak at a wavelength of approximately 440 nm indicates successful coupling of folate to particle surfaces.](/cms/asset/40c18111-d429-4789-a65f-fbfc928a1375/dijn_a_24792_f0004_c.jpg)
Figure 5 Fourier transform infrared spectra of nanoparticles-(fluorescein isothiocyanate)-polyethylene glycol-Folate (NPs[FITC]-PEG-Folate) particles (A) and NPs(FITC) particles (B).
![Figure 5 Fourier transform infrared spectra of nanoparticles-(fluorescein isothiocyanate)-polyethylene glycol-Folate (NPs[FITC]-PEG-Folate) particles (A) and NPs(FITC) particles (B).](/cms/asset/f3d3f5a0-81b7-4e32-a5a5-2814c1281a99/dijn_a_24792_f0005_c.jpg)
Figure 6 Zeta potential measurements. (A) The zeta potential of unmodified nanoparticles-(fluorescein isothiocyanate) (NPs[FITC]) particles was −23.0 mV. (B) The zeta potential of NPs(FITC)-polyethylene glycol-Folate particles was −23.1 mV.
![Figure 6 Zeta potential measurements. (A) The zeta potential of unmodified nanoparticles-(fluorescein isothiocyanate) (NPs[FITC]) particles was −23.0 mV. (B) The zeta potential of NPs(FITC)-polyethylene glycol-Folate particles was −23.1 mV.](/cms/asset/7a6cff07-5db8-4247-9791-b261b5241f58/dijn_a_24792_f0006_c.jpg)
Figure 7 Evaluation of cellular uptake (internalization). Nontargeted nanoparticles-(fluorescein isothiocyanate) (NPs[FITC]) particles (upper panels) and targeted NPs(FITC)-polyethylene glycol(PEG)-Folate particles (lower panels) were incubated with KB cells for 6 hours at 37°C, then washed three times with phosphate buffer solution and observed under an inverted fluorescence microscope (magnification 200×).
![Figure 7 Evaluation of cellular uptake (internalization). Nontargeted nanoparticles-(fluorescein isothiocyanate) (NPs[FITC]) particles (upper panels) and targeted NPs(FITC)-polyethylene glycol(PEG)-Folate particles (lower panels) were incubated with KB cells for 6 hours at 37°C, then washed three times with phosphate buffer solution and observed under an inverted fluorescence microscope (magnification 200×).](/cms/asset/9ab9e0e3-88ed-42bd-819e-c0c5f1ead6af/dijn_a_24792_f0007_c.jpg)
Figure 8 Confocal laser scanning microscopy images of KB cells after a 6 hour incubation period at 37°C with nontargeted nanoparticles-(fluorescein isothiocyanate) (NPs[FITC]) (A) and targeted NPs(FITC)-polyethylene glycol-Folate (B) (magnification 400×).
![Figure 8 Confocal laser scanning microscopy images of KB cells after a 6 hour incubation period at 37°C with nontargeted nanoparticles-(fluorescein isothiocyanate) (NPs[FITC]) (A) and targeted NPs(FITC)-polyethylene glycol-Folate (B) (magnification 400×).](/cms/asset/dd5a44c3-597a-42a6-9575-9f0469b565e4/dijn_a_24792_f0008_c.jpg)
Figure 9 Cellular internalization of nanoparticles-(fluorescein isothiocyanate) (NPs[FITC]) and NPs(FITC)-polyethylene glycol(PEG)-Folate particles. All experiments were carried out with 6 hour incubation with A549 or KB cells, followed by washing three times with phosphate buffer solution and detection by flow cytometry. To obtain the rightmost bar, free folate (1 mM) was preincubated with KB cells for 1 hour before the incubation of NPs(FITC)-PEG-Folate.
Notes: *P < 0.05 vs NP(FITC) or NPs(FITC)-PEG-Folate in A549 cells or NP(FITC) in KB cells; #P < 0.05 vs NPs(FITC)-PEG-Folate in KB cells.
![Figure 9 Cellular internalization of nanoparticles-(fluorescein isothiocyanate) (NPs[FITC]) and NPs(FITC)-polyethylene glycol(PEG)-Folate particles. All experiments were carried out with 6 hour incubation with A549 or KB cells, followed by washing three times with phosphate buffer solution and detection by flow cytometry. To obtain the rightmost bar, free folate (1 mM) was preincubated with KB cells for 1 hour before the incubation of NPs(FITC)-PEG-Folate.Notes: *P < 0.05 vs NP(FITC) or NPs(FITC)-PEG-Folate in A549 cells or NP(FITC) in KB cells; #P < 0.05 vs NPs(FITC)-PEG-Folate in KB cells.](/cms/asset/1abdd4bc-e109-4d74-9b0d-8364c51edacb/dijn_a_24792_f0009_b.jpg)
Figure 10 Investigation of the mechanisms of cellular internalization by using inhibitors of endocytosis. KB cells were incubated with the indicated inhibitors (sodium azide [NaN3], chlorpromazine [Chl], nystatin [Nys], and cytochalasin D [Cyt D]). The internalization ratio was normalized to that of the control (particle internalization in the absence of inhibitors).
Note: *P < 0.05 vs control (no inhibitors added).
![Figure 10 Investigation of the mechanisms of cellular internalization by using inhibitors of endocytosis. KB cells were incubated with the indicated inhibitors (sodium azide [NaN3], chlorpromazine [Chl], nystatin [Nys], and cytochalasin D [Cyt D]). The internalization ratio was normalized to that of the control (particle internalization in the absence of inhibitors).Note: *P < 0.05 vs control (no inhibitors added).](/cms/asset/e1c608a7-a021-4bd2-b26a-92c4c6da391a/dijn_a_24792_f0010_b.jpg)