Figures & data
Table 1 Comparison of commonly-used methods of quantifying bacteria viability
Table 2 Summary of select studies concerning the antimicrobial effects of nanoparticles
Figure 1 Zinc oxide (ZnO) nanoparticles (A), Escherichia coli bacteria prior to exposure to ZnO nanoparticles (B), and E. coli bacteria after exposure to ZnO nanoparticles (C). Membrane irregularities were observed in bacteria exposed to ZnO nanoparticles. With kind permission from Springer Science+Business Media: Journal of Nanoparticle Research. Investigation into the antibacterial behaviour of suspensions of ZnO nanoparticles (ZnO nanofluids). 9(3), 2007, page 483. Zhang L. .Citation8
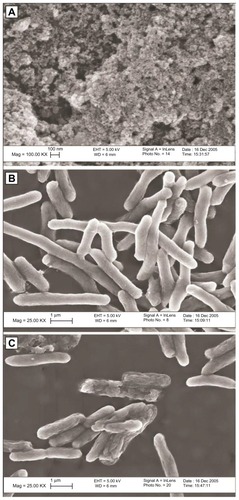
Figure 2 Transmission electron microscope images of silver nanoparticles used (A). Scanning electron microscope image of Escherichia coli control group (B) and E. coli exposed to 50 μg/mL of silver nanoparticles in lysogeny broth medium for 4 hours (C). Transmission electron microscope image of E. coli exposed to 50 μg/mL of silver nanoparticles in lysogeny broth medium for 1 hour at low magnification (D) and high magnification (E). Reprinted from Journal of Colloid and Interface Science, 275(1). Sondi I, Salopek-Sondi B. Silver nanoparticles as antimicrobial agent: a case study on E. coli as a model for Gram-negative bacteria. 177–182. Copyright © (2004), with permission from Elsevier.Citation3
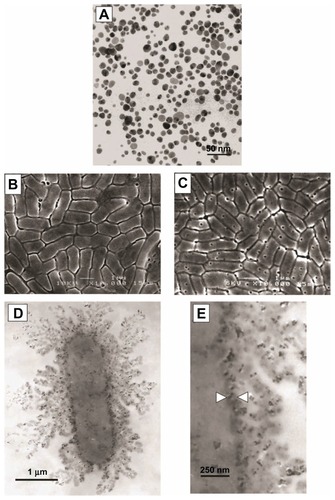
Figure 3 Illustration comparing bacteria surface interactions with nanorough surfaces and conventional nanosmooth surfaces. Due to the high degree of roughness on nanomaterials, rigid bacteria cell membranes cannot lay flush against the material surface. This may inhibit the preliminary steps which lead to bacteria adhesion. As a result, bacteria activity on a nanomaterial surface may be reduced.
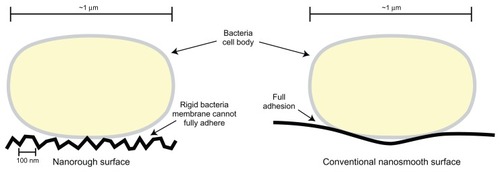
Figure 4 Atomic force microscopy images of particle compacts of microphase zinc oxide (ZnO) (A) and nanophase ZnO (B). Analysis indicated that compacts of nanophase ZnO had a 25% increase in surface area. Copyright © 2006, John Wiley and Sons. Adapted with permission from Colón G, Ward BC, Webster TJ. Increased osteoblast and decreased Staphylococcus epidermidis functions on nanophase ZnO and TiO2. J Biomed Mater Res A. 2006;78(3):595–604.Citation7
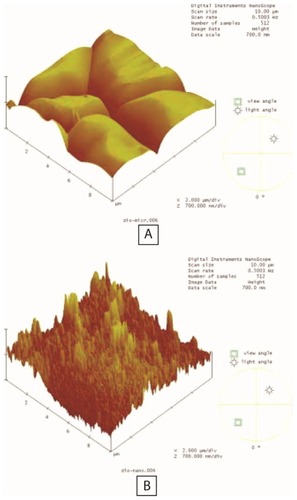
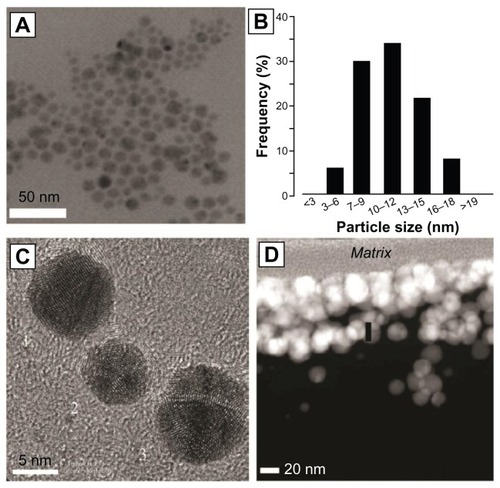
Figure 5 X-ray electron microscopy image of silver nanoparticles (A) and a particle size distribution histogram (B) of those particles. Higher magnification reveals polyhedral structure (C). Nondisruptive electron transmission microscopy reveals an 80–120 nm coating of silver nanoparticles on the surfaces of a polymer catheter (D).