Figures & data
Figure 1 Isolation, characterization, and internalization of human bone marrow-derived mesenchymal stromal cells (hBMSCs)-derived exosomes. (A) Morphology of exosomes under TEM. Negative staining demonstrated typical cup-shaped exosomal morphology. (B) Size distribution determined by NTA. (C) Representative confocal microscopy images of exosome internalization by RAW264.7 cells at 12 h, 24 h, and 48h. Scale bars: 200 μm. (D) Representative confocal microscopy images of exosome internalization by hBMSCs at 12 h, 24 h, and 48 h. Scale bars: 100 μm for low magnification images and 10 μm for high magnification images. Results are representative of three independent experiments.
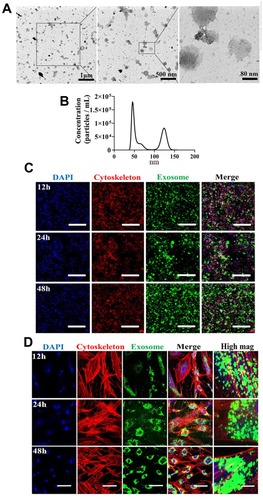
Figure 2 Surface characterization of exosomes immobilized onto PCL/PDA and PCL/PDA + GNSO scaffolds. Representative confocal microscopy images of PCL/PDA (A), PCL/PDA + GSNO (B), PCL/PDA + exosome (C), and PCL/PDA + GSNO + exosome (D) scaffolds. Exosomes were labeled with PKH67 exosome staining solution and incubated with either PCL/PDA or PCL/PDA + GSNO scaffolds. As a control, PCL/PDA or PCL/PDA + GSNO scaffolds were incubated with PKH67 alone. Scale bars for low magnification images represent 50 μm and for high magnification images, 10 μm.
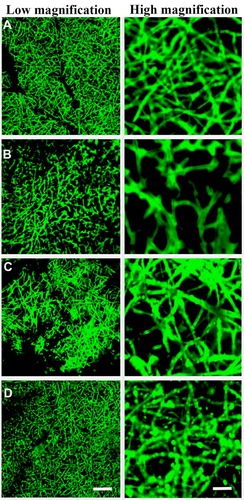
Figure 3 Internalization of scaffold-immobilized with exosomes by RAW 264.7 cells. Representative confocal microscopy images of RAW 264.7 cells co-cultured with PCL/PDA (A), PCL/PDA + GSNO (B), PCL/PDA + exosome (C), and PCL/PDA + GSNO + exosome (D). Exosomes were pre-labeled with green fluorescent PKH67 prior to immobilization onto scaffolds. Cells were collected at 4 h and 24 h and stained with Alexa Fluor 594-conjugated phalloidin (red), and DAPI (blue). Scale bars: 100 μm.
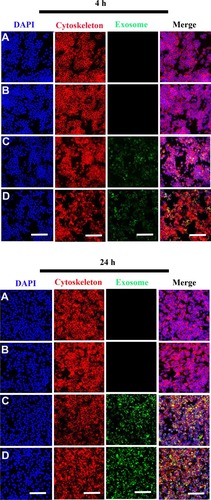
Figure 4 Internalization of scaffold-immobilized with exosomes by hBMSCs. Representative confocal microscopy images of hBMSCs co-cultured with PCL/PDA (A), PCL/PDA + GSNO (B), PCL/PDA + exosome (C), and PCL/PDA + GSNO + exosome (D). Exosomes were pre-labeled with green fluorescent PKH67 prior to immobilization onto scaffolds. Cells were collected at 4 h and 24 h and stained by Alexa Fluor 594-conjugated phalloidin (red), and DAPI (blue). Scale bars: 100 μm.
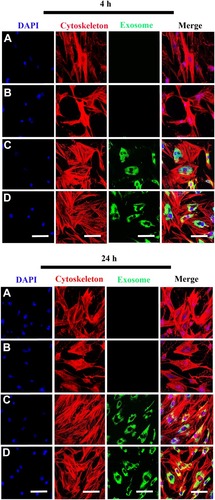
Figure 5 Scaffold-induced changes in macrophage morphology captured by confocal microscopy after lipopolysaccharide (LPS) stimulation. (A) Representative confocal microscopy images of RAW264.7 cells co-cultured with PCL/PDA (a), PCL/PDA + GSNO (b), PCL/PDA + exosome (c), and PCL/PDA + GSNO + exosome (d) scaffolds. RAW 264.7 cells were stimulated with 1 μg/mL LPS for 12 h before co-culturing with scaffolds for 24 h. Cells were stained with Alexa Fluor 594-conjugated phalloidin (red) and DAPI (blue). Scale bars: 100 μm for DAPI, Cytoskeleton, and Merge panels. In high magnification panel, scale bars represent 10 μm (left) and 50 μm (right). (B–C) Quantification of cell area ratio (B) and elongation ratio (C). ImageJ was used to quantify the macrophage area and elongation ratios. Error bars denote mean ± SD of 50 individual cells. *p < 0.05 relative to PCL/PDA group.
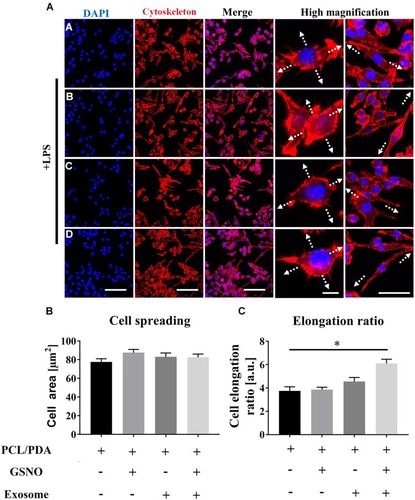
Figure 6 Scaffold-induced changes in macrophage morphology captured by scanning electron microscopy (SEM) after LPS stimulation. (A) Representative SEM images of RAW264.7 cells co-cultured with PCL/PDA (a), PCL/PDA + GSNO (b), PCL/PDA + exosome (c), and PCL/PDA + GSNO + exosome (d) scaffolds. RAW 264.7 cells were stimulated with 1 μg/mL LPS for 12 h before co-culturing with scaffolds for 24 h. Scale bars: 2 μm (left panel), 1 μm (middle and right panel). (B) Relative expression of inflammatory genes in RAW 264.7 cells after 12h stimulation with LPS and co-culture with scaffolds for a further 24 h. Values were normalized to the housekeeping gene, GAPDH. Error bars denote mean ± SD. *p < 0.05, **p < 0.01, ***p < 0.0005, ****p < 0.0001 relative to PCL/PDA control.
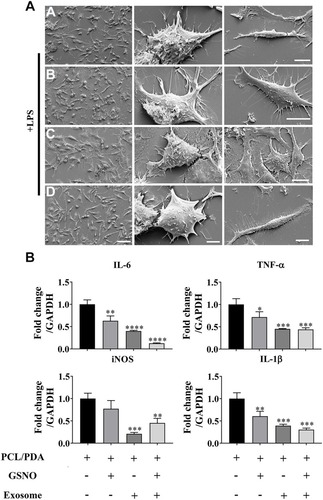
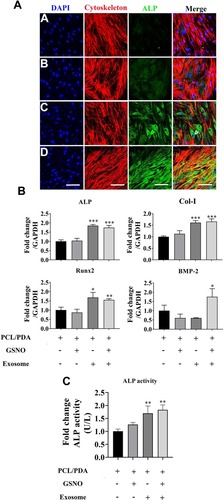
Figure 7 The effect of different scaffolds on the osteogenic differentiation of hBMSCs. (A) Representative confocal microscopy images of hBMSCs supplemented with osteogenic differentiation medium and co-cultured with PCL/PDA (a), PCL/PDA + GSNO (b), PCL/PDA + exosome (c), and PCL/PDA + GSNO + exosome (d) scaffolds. Cells were stained by Alexa Fluor 594-conjugated phalloidin (red), alkaline phosphatase (ALP; green), and DAPI (blue). All scale bars: 200 μm. (B) Relative expression of osteogenic-related genes from samples treated as (A) and collected at 3 d post-seeding. Error bars denote mean ± SD. *p < 0.05, **p < 0.01, ***p < 0.0005 relative to PCL/PDA control. (C) hBMSCs were co-cultured with different scaffolds as (A) and ALP activity measured after 7 d in culture. Error bars denote the mean ± SD (n = 3). **p < 0.01 relative to PCL/PDA control.