Figures & data
Figure 1 Representative UV-Vis spectra of 5 nm diameter Au-SOA-HPC-HT i) before and ii) after the addition of 6.14 mM KCN for 1 h in H2O.
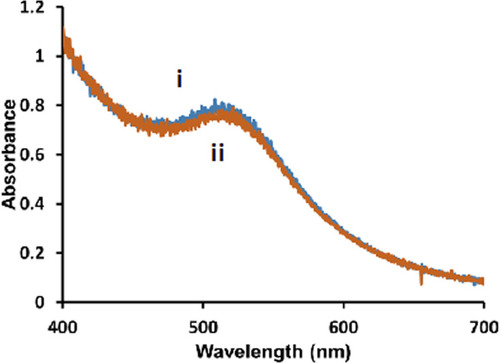
Figure 2 Percent change in O.D. of hybrid lipid capped Au-SOA-HPC-HT in 10 mM sodium phosphate buffer pH 8.0 1 h after (A) exposure to 50 mM, 150 mM, or 200 mM NaCl (aq) and (B) adjustment of pH to 2 and 5 with 2 M HCl. Data mean ± SE reported for n = 3.
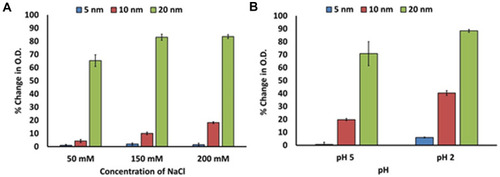
Figure 3 SFG spectra in the CD region of (A) LC+LE monolayer and (B) a LC monolayer before and after the injection of 5 nm AuNPs. The black squares show the lipid monolayer before NPs were injected. The blue circles show the lipid monolayer and NP interaction after 4 h. The symmetric CD3 stretch is at 2075 cm−1 with the symmetric CD2 stretch at 2100 cm−1. The symmetric CD2 peak disappears after NP injection for both LC (A) and LC+LE (B) monolayers indicating the NPs pushed the lipid tails into a trans conformation.
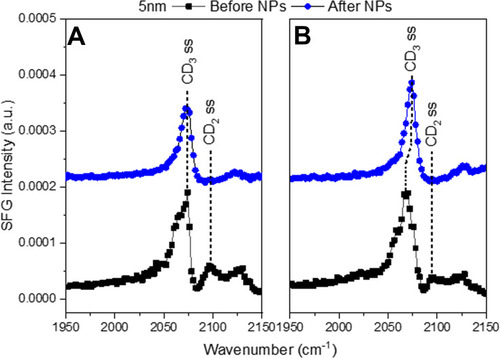
Figure 4 Representative SFG spectra in the CD region of (A) with a LC+LE monolayer and (B) with a LC monolayer. The black squares show the lipid monolayer before 20 nm NPs were injected. The blue circles show the lipid monolayer and NP interaction after four hours. The symmetric CD3 stretch is at 2075 cm−1 with the symmetric CD2 stretch at 2100 cm−1. The LC (A) monolayer SFG signal disappeared indicating a collapse of the lipid monolayer. In the LC+LE (B) monolayer the small CD2 peak shows an intact monolayer. These spectra exhibit the difference the initial monolayers have on AuNP–lipid interactions.
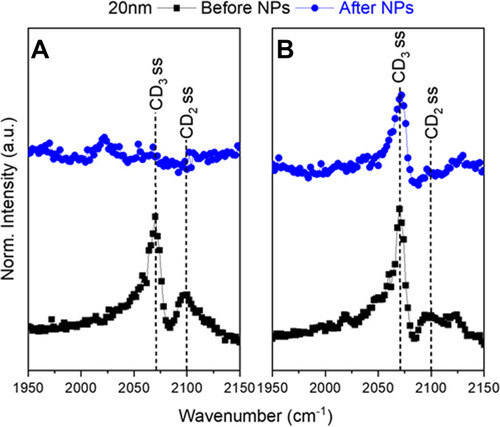
Figure 5 SFG spectra showing the CH region for each of the 5, 10, 20 nm Au-SOA-HPC-HT. The NPs are at an air/water interface free of any lipids. The CH2 asymmetric stretch is at 2913 cm−1 with the CH3 asymmetric stretch at 2963 cm−1. The NPs exhibit only asymmetric stretches which indicates strong ordering of the lipid coating.
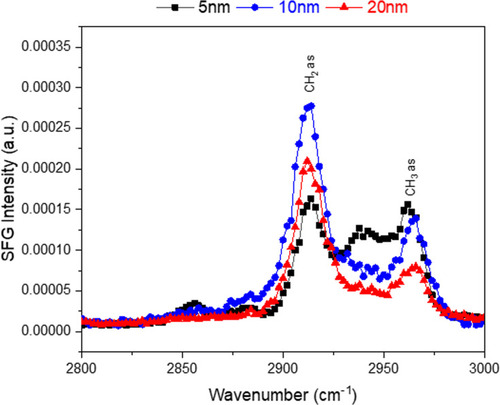
Figure 6 Representative SFG spectra showing the CH region for the lipid monolayer, 20 nm Au-SOA-HPC-HT and the NP-dDPPC lipid interface. The black squares correspond to only the lipid monolayer at the air/water interface. The red triangles correspond to only the Au-SOA-HPC-HT. The blue circles correspond to the interaction of NPs and the lipid monolayer at the surface after 4 hrs. The CH2 asymmetric stretch is at 2913 cm−1 with the CH3 asymmetric stretch at 2963 cm−1. The spectra show that NPs are at the NP-dDPPC interface and responsible for the observed structural changes in the lipid monolayer.
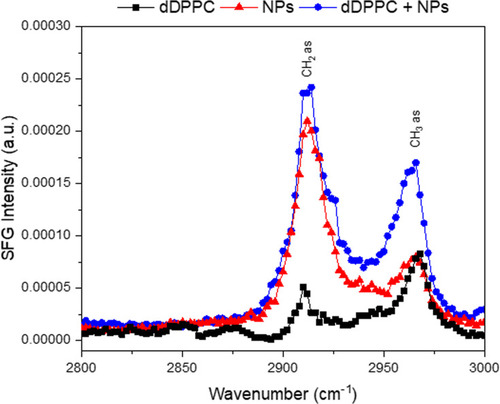
Figure 7 Concentration–response curves of zebrafish mortality at (A) 24 hpf and (B) 120 hpf. This data represents two experimental replicates of n = 12 for a total of n = 24 for each exposure condition. *Indicates significant difference from control by a Fisher’s exact test (p-value < 0.05).
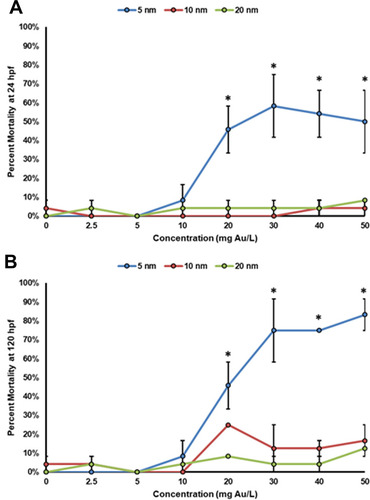
Figure 8 Malformations assessed at 24 hpf show delayed developmental progression, notochord malformations, and effects on spontaneous movement in the zebrafish exposed to the (A) 5 nm, (B) 10 nm, and (C) 20 nm AuNPs. This data represents two experimental replicates of n = 12 for a total of n = 24 for each exposure condition. *Indicates significant difference from control by a Fisher’s exact test (p-value < 0.05).
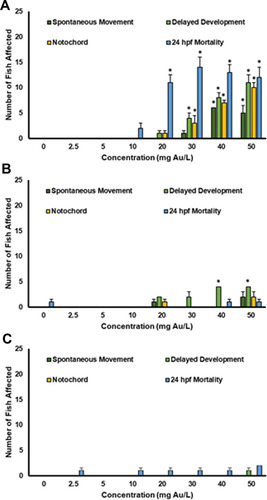
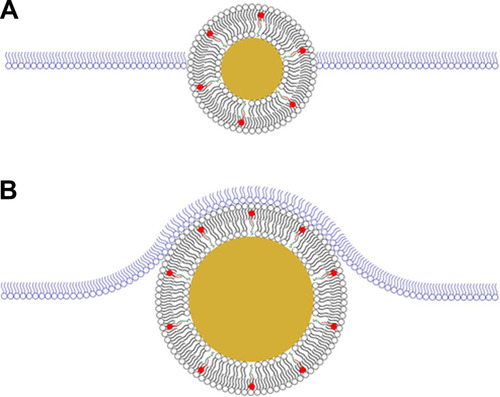
Figure 9 Proposed size-dependent interactions between hybrid lipid-coated AuNPs and biomimetic lipid monolayer. The 5 nm and 10 nm AuNPs were able to phase into the membrane (A) whereas the 20 nm AuNPs induced curvature of the membrane (B). AuNP membranes composed of hPC (black) and SOA (red) are anchored to the surface with HT (green). The lipid monolayer is composed of dDPPC (blue).