
Figures & data
Figure 1 Scanning electron microscope of CaPNs.
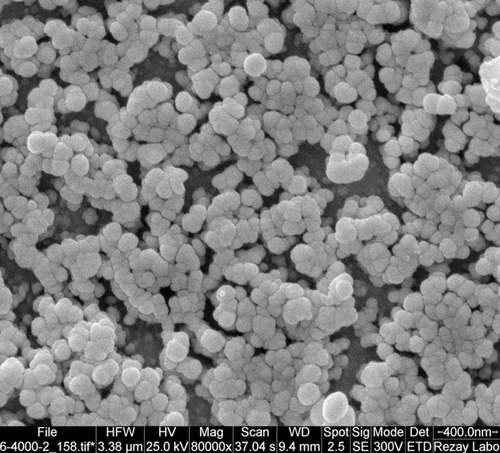
Figure 2 Release profile of different antigens-CaPNs at pH 7.4 and 37 °C for 96 hours (data are mean± SD, n = 3).
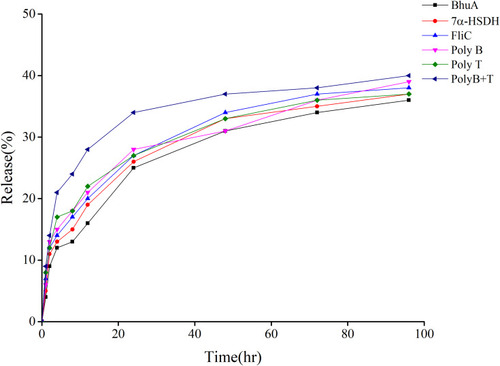
Figure 3 The specific antibody levels in different dilutions of mice sera after immunization with BhuA-, FliC-, 7α-HSDH-, poly B-, poly T-, and poly B+T-CaPNs. (A) After the first immunization. (B) After the second immunization. (C) After the third immunization.
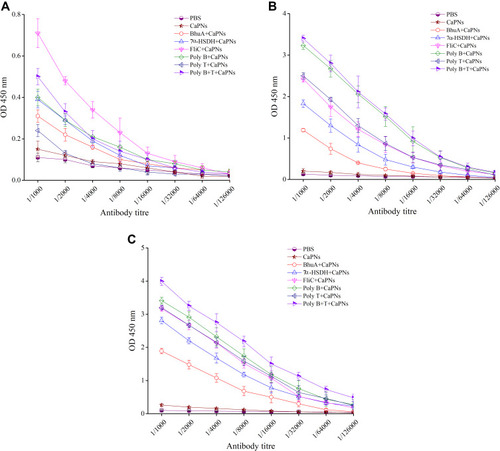
Figure 4 IgG subtypes in mice sera after immunization with different vaccine formulations.
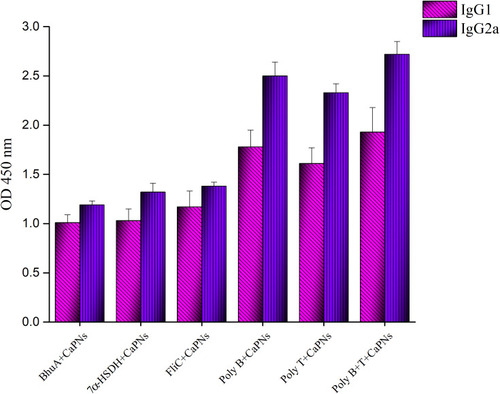
Figure 5 Splenocyte proliferative responses of different mice groups. Data are the mean SI ± SD of three mice from each group were evaluated in triplicate. Statistically significant difference (p < 0.05) with the control groups is indicated by an asterisk.
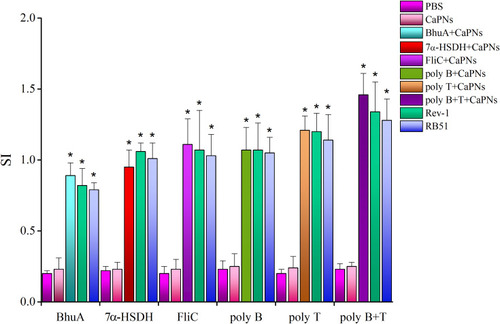
Figure 6 The levels of IFN-γ (A), IL-2 (B), and IL-10 (C) production by splenocytes of immunized mice with BhuA-, FliC-, 7α-HSDH-, poly B-, poly T-, poly B+T-CaPNs, Rev.1 and RB51. Statistically significant difference (p < 0.05) compared to the control groups is indicated by an asterisk.
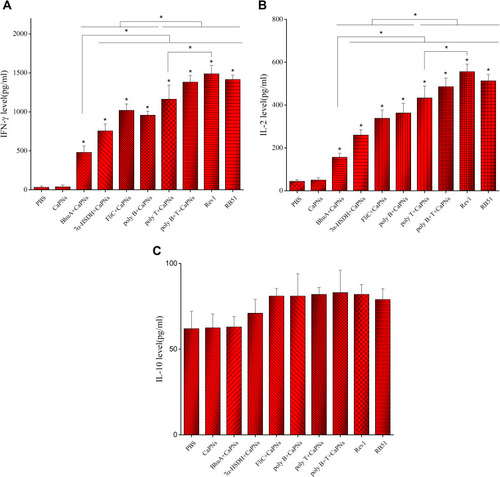
Table 1 Protection Against B. melitensis 16M and B. abortus 544 Challenge in Immunized Mice