Figures & data
Table 1 The Data from Experimental Design of Independent Variables for Optimization of Cs/Alg/B NPs
Figure 1 SEM images of morphological degradation of Cs/Alg/B NPs. (A) The initial stage of degradation on the 7th day of preparation. (B) End-stage of morphological degradation after the 14th day of preparation. For each run MDT is included in optimization as a quantitative factor. The scale bar is 300 nm. More images are shown in Supplementary .
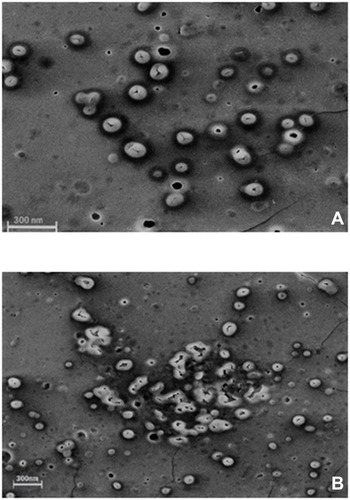
Figure 2 3D Response surface plots (A−C) and contour plots (D−F) for the mean particle size of Cs/Alg/B NPs. 3D and contour graphs are the preservative relative relationship between two variables on the size of Cs/Alg/B NPs. Contour plots show a three-dimensional surface on a two-dimensional plane. It graphs two predictor variables, X and Y, on the y-axis and a response variable, Z, as contours. Cs/Alg/B NPs, rhBMP-2-loaded chitosan/alginate nanoparticles.
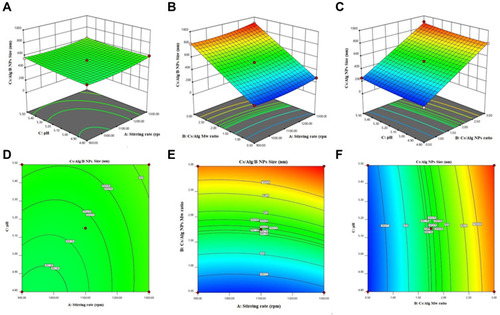
Figure 3 3D Response surface plots (A−C) and contour plots (D−F) for the mean LE of Cs/Alg/B NPs. 3D and contour graphs are the preservative relative relationship between two variables on the size of Cs/Alg/B NPs LE (%). Contour plots show a three-dimensional surface on a two-dimensional plane. It graphs two predictor variables, X and Y, on the y-axis and a response variable, Z, as contours. LE, loading efficacy (%); Cs/Alg/B NPs, rhBMP-2-loaded chitosan/alginate nanoparticles.
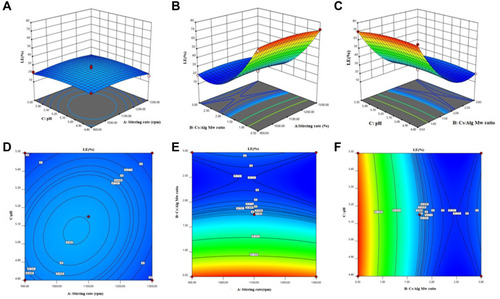
Figure 4 SEM micrographs of Cs/Alg/B NPs prepared with the optimum formulation of Cs/Alg/B NPs with variables as; Cs/Alg Mw ratio=1, stirring rate=5, pH=5.3 at preparation day. The scale bar is 1 µm.
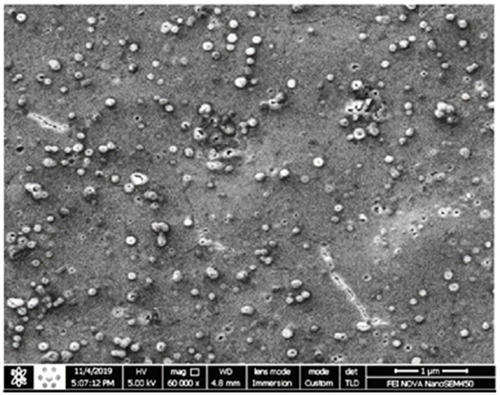
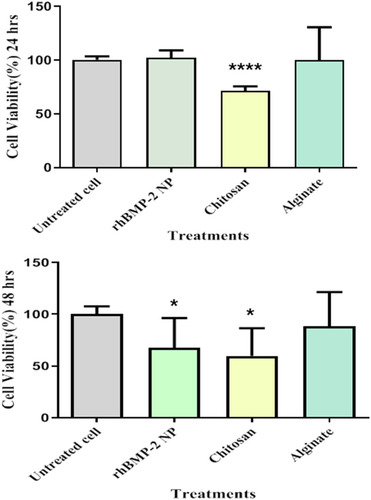
Figure 5 Cytotoxicity effects of chitosan, alginate, and Cs/Alg/B NPs on NIH 3T3cells at 24 and 48 hours. The NIH 3T3 cells were cultured in 96-well plates and were exposed to 10 µg chitosan, alginate, Cs/Alg/B NPs (26 µg/mL), and negative control (RPMI 1640). Positive control (untreated cell). Cell viability calculated as; viability (%)=Mean OD/Control OD×100%. All data are presented as the mean of three different measurements±SD, asterisks (*) represent means the significant difference from the control group by the Bonferroni posttest (P<0.05) and asterisks (****) P<0.0001. OD, optical density; SD, standard deviation.; Cs/Alg/B NPs(rhBMP-2 NPs), rhBMP-2-loaded chitosan/alginate nanoparticles.