Figures & data
Table 1 Experimental Arrangement of Hemolysis Assay
Table 2 The Characteristics of LCTL Prepared by REV and IBL Methods
Figure 1 The TEM images and a plot curve of the DLS-determined hydrodynamic diameter of LCTL. (A) The TEM images of LCTL prepared by REV. (B) The DLS-curve of LCTL prepared by REV. (C) The TEM images of LCTL prepared by IBL. (D) The DLS-curve of LCTL prepared by IBL.
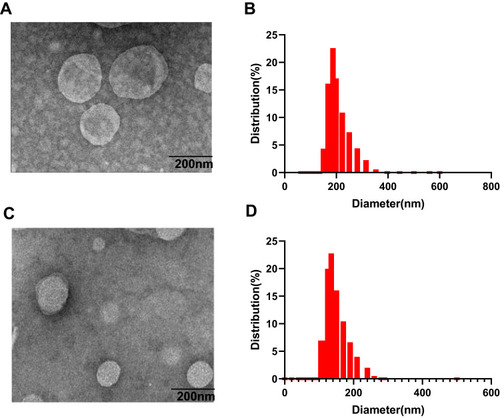
Table 3 The Optimal Conditions for REV
Figure 2 DSC thermograms of blank LCTL (A) and LCTL/L-OHP (B).
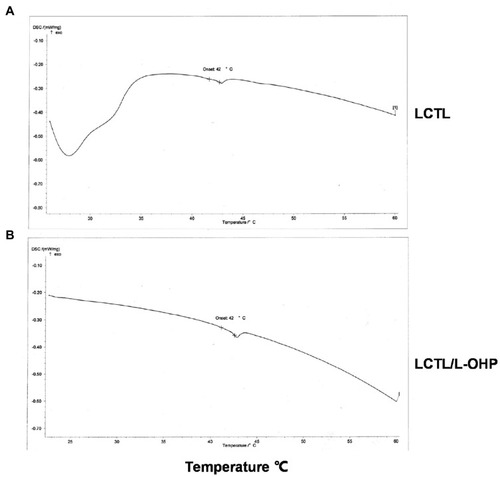
Figure 3 (A) The change of EE for TL, LCL, LCTL after lyophilization with different cryoprotectants. (B) The change of EE for TL, LCL, LCTL after storage at 4°C for one month. Data are represented as the mean±SD from three independent experiments. **p < 0.01, ***p < 0.001.
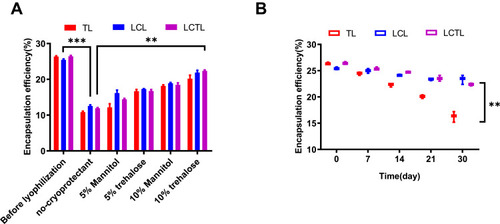
Table 4 The Stability of LCTL at 4°C After One Month
Figure 4 The accumulative release percentage of L-OHP from free L-OHP solution, LCL, LCTL in PBS at 37°C and 42°C. Results are represented as the mean±SD from three independent experiments. ***p < 0.001.
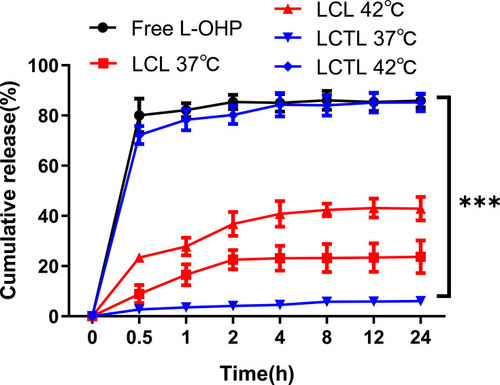
Figure 5 Cell viability of different cells after the treatment of LCTL to RKO (A), L02 (B), and 4T1 cell lines (C) at 37°C and 42°C after incubation for 48h. (D) The IC50 of the LCTL to RKO, L02 and 4T1 cells. Results are expressed as the mean±SD from five independent experiments. ***p < 0.001.
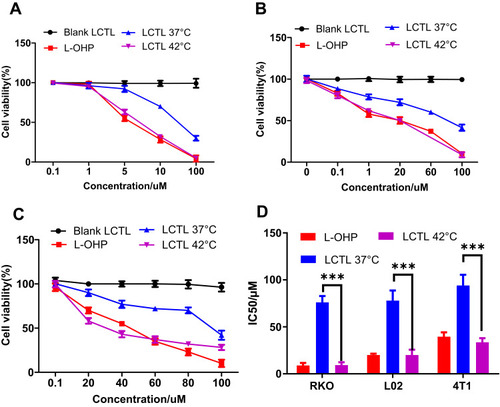
Figure 6 The cellular uptake of platinum after the incubation with free L-OHP solution, TL and LCTL on 4T1 cells at different times of 1h, 2h, 4h, 6h, 8h, 10h, 12h. The data are represented as the mean±SD from three independent experiments. **p < 0.01.
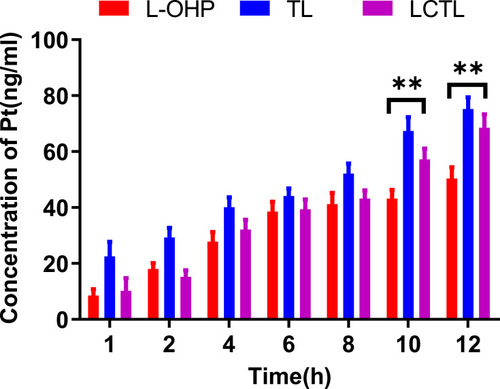
Table 5 The Characteristics of Different DiR-Loaded Liposomes
Figure 7 (A) In vivo imaging of 4T1-bearing mice after administration of DiR-loaded TL and LCTL at 1h, 6h, 8h and 24h. (B) In vivo imaging of tissue from mice at 24h. (C) The quantitative analysis of the fluorescence intensity in tumors at 24h. ***p < 0.001. Results are expressed as the mean±SD from five independent experiments.
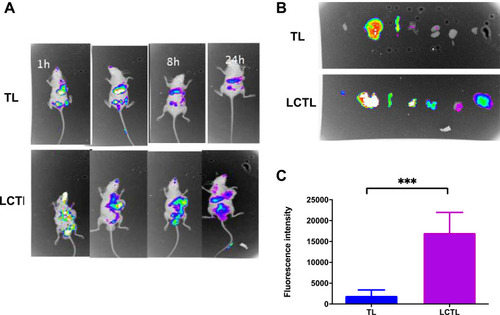
Table 6 Pharmacokinetic Parameters of the L-OHP Solution, TL, and LCTL After Injection (n=5)
Figure 8 (A) The AIC of the L-OHP solution, LCTL, and TL for the one-compartment model and two-compartment model. (B) Mean plasma concentration–time profiles of the platinum after the treatment of L-OHP solution, LCTL, and TL (n=5).
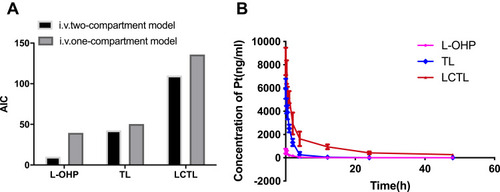
Figure 9 (A) The hemolytic rate of red blood cells after incubation with different concentration of L-OHP, TL, LCTL formulations. (B) The irritation to the vessels after the administration of saline (a), L-OHP solution (b), TL (c) and LCTL (d).
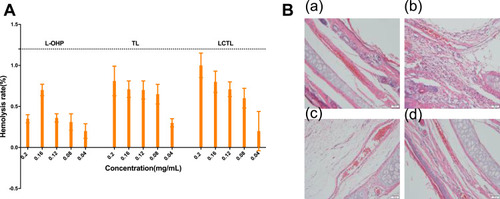
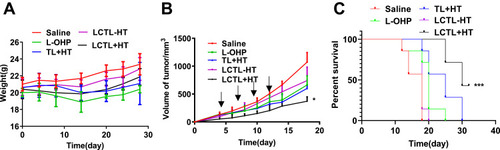
Figure 10 The evaluation of anti-tumor effect on 4T1-bearing mice. (A) The weight changes of mice after the administration with physical saline, free L-OHP, TL+HT, LCTL with HT and LCTL without HT (n=7). (B) Tumor growth of mice bearing 4T1 tumor, which were intravenously administrated with physical saline, free L-OHP, TL+HT, LCTL with HT and LCTL without HT (n=7). (C) The survival curves after administration with physical saline, free L-OHP, TL+HT, LCTL with HT and LCTL without HT. Each symbol represents the mean of 7 animals and the bars correspond to the standard deviation. The local tumors of mice were heated at 42°C for 30 min each time for +HT groups. *p < 0.05, ***p < 0.001. Results are expressed as the mean±SD from five independent experiments.
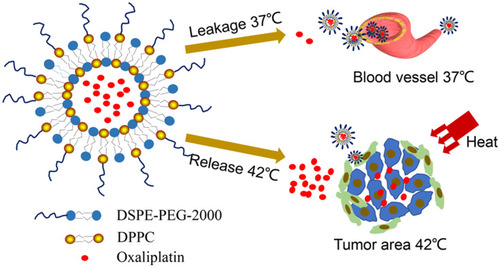
Scheme 1 Schematic diagram of the heat-triggered release from long-circulating L-OHP-loaded thermosensitive liposomes.