Figures & data
Figure 1 M/P/D-micelles transport in skin (schematic).
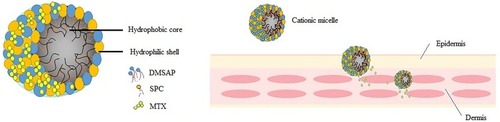
Figure 2 The synthesis of [[3-(dimethylamino) propyl] imino] -di-2,1- ethanediyl ester (DMSAP).
![Figure 2 The synthesis of [[3-(dimethylamino) propyl] imino] -di-2,1- ethanediyl ester (DMSAP).](/cms/asset/17783a42-6543-4933-a64c-3c717395b882/dijn_a_12194646_f0002_c.jpg)
Figure 3 1H NMR spectra of DMSAP (CDCl3; internal standard, tetramethylsilane).
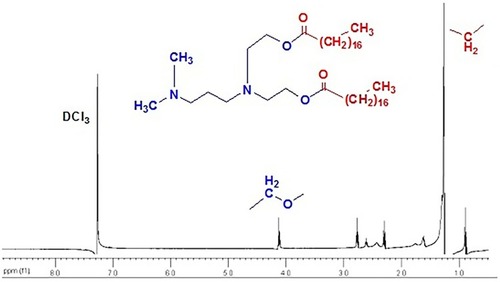
Figure 4 Mass spectrum of DMSAP.
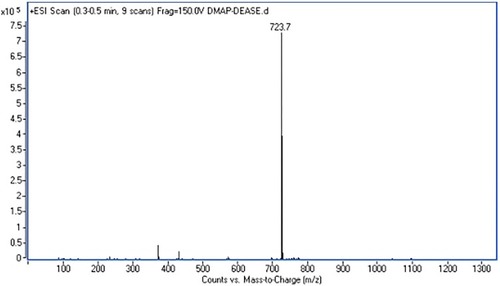
Figure 5 The I374/I385 ratio of pyrene fluorescence as a function of DMSAP concentration.
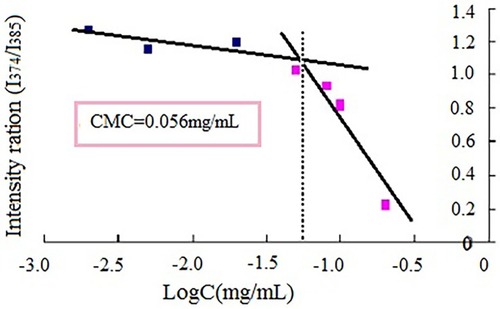
Figure 6 DMSAP micelles at a SPC/DMSAP ratio of 1:3 were sonicated for 10 min (A: before sonication; B: after sonication).
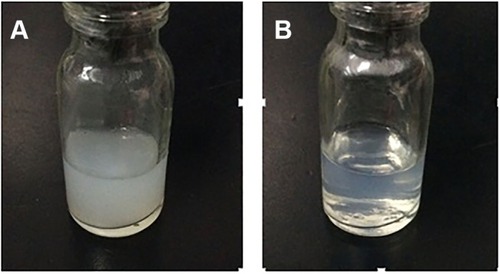
Figure 7 Size and zeta potential of micelles prepared at different ratios of SPC and DMSAP. Compared with blank and MTX-in the different ratios of SPC and DMSAP (mean ± SD; n=3).
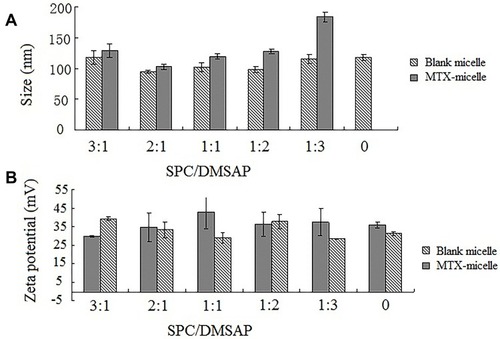
Figure 8 TEM of D-micelles and P/D-micelles. A: micelles self-assembled by 50mg of DMSAP in 10 mL of HEPES and after dilution with distilled water. B: Micelles formed by 75 mg of DMSAP and 25 mg SPC in the same way as A. DMSAP self-assembled to be form cylindrical micelles. Mixed lipids formed spherical micelles.
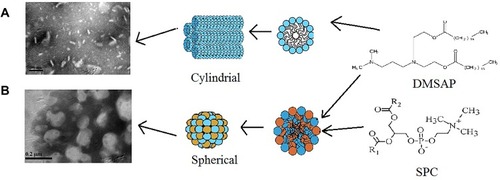
Figure 9 Micelles diameters were determined under different ionic strength solutions and different concentrations of BSA (A: Under different concentrations of MgSO4, Na2SO4, CaCl2 and MgCl2 in 2, 4, 8, 10, 15, 20 and 40 mM; B: Size and zeta potentials under different concentrations of BSA in 0, 2, 5, 7.5, 10 and 12.5 mM.).
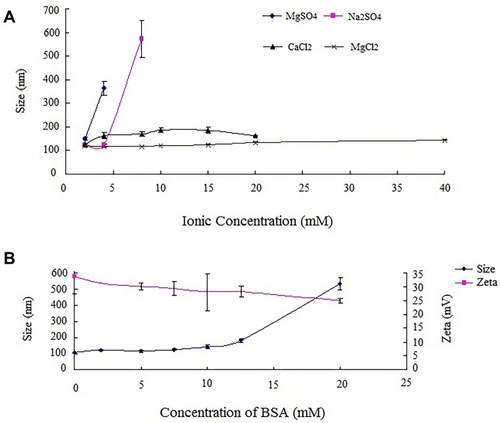
Figure 10 Efficiency of MTX entrapment in micelles using different ratios of MTX/total lipids and SPC/DMSAP. A: The ratio of MTX to total lipids was 1:5, 1:7.5, 1:10 and 1:15. B: The ratio of SPC to DMSAP was 3:1, 2:1, 1:1, 1:2 and 1:3.
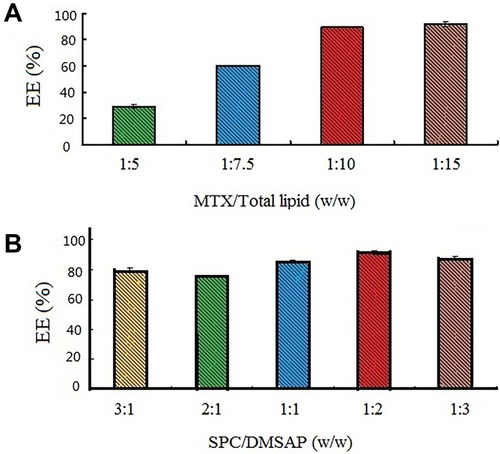
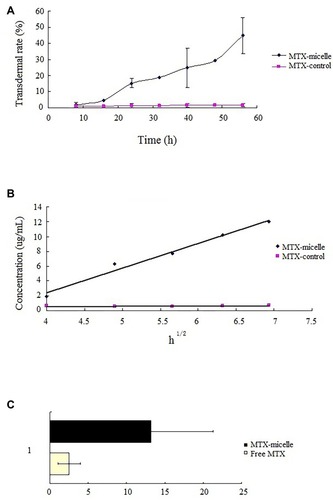
Figure 11 Volume of MTX permeated across and retained in the mice skin. A: The relationship between the MTX percentage permeated across mice skin and time. B: Linear fitting of MTX volume that permeated across mice skin and time 1/2 as micelles or not as micelles. C: Relationship between the MTX percentage retained in mice skin as micelles or not as micelles.