Figures & data
Figure 1 (A) Illustration of the formation and disintegration process of the DSG hydrogels. (B) Illustration of the formation of TAMs/tumor cells model.
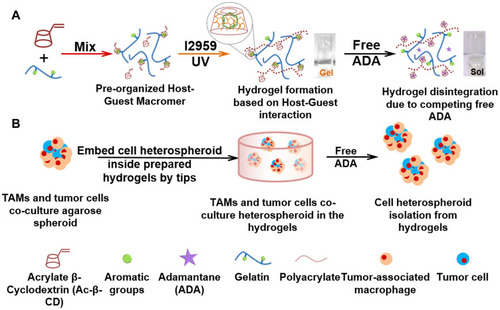
Figure 2 The properties of DSG hydrogels. (A) The rheological time sweep test for DSG hydrogels with different concentration of gelatin and Ac-β-CD at 25°C. (The solid symbols represent storage modulus (G’) and the hollow symbols represent loss modulus (G”)). (B) The gelation time test for Gel8CD10 hydrogel group at 25°C. (Insert graph: the enlarged view for the region of 0–300s). (C) The rheological frequency sweep of Gel8CD10 hydrogel group at 25°C. (D) The rheological time sweep test for DcS hydrogels before and after the addition of ADA at 37°C.
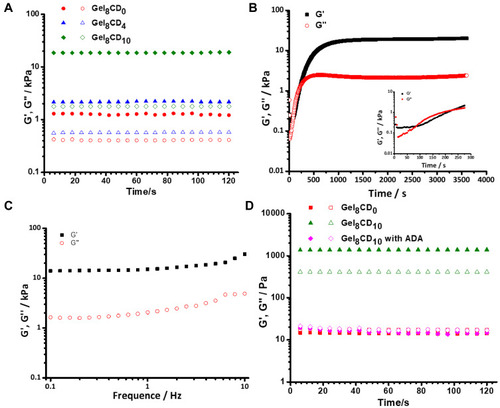
Figure 3 Protein expression levels of THP-1 M0 cells polarization for 24 h in the presence of IFN-γ or IL-4, respectively. (A) Western blot analysis of iNOS (upper), relative expression of iNOS (lower) in 2D. (B) Western blot analysis of Arg1 (upper), relative expression of Arg1 (lower) in 2D. (C) Western blot analysis of iNOS (upper), relative expression of iNOS (lower) in 3D. (D) Western blot analysis of Arg1 (upper), relative expression of Arg1 (lower) in 3D. Data are presented as means ± standard deviations (n = 3). *p< 0.01.
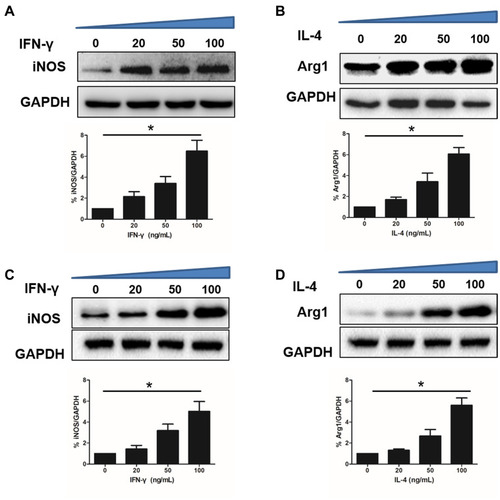
Figure 4 Relative M1 subtype markers expression of macrophage cells and cell viability in DSG hydrogels. (A) Relative iNOS and CD68 mRNAs expression of macrophage cells. (B) Relative iNOS protein expression of macrophage cells (1:M0; 2:M2; 3:M2 Reprogrammed; 4:M1). (C) Relative CD68 protein expression of macrophage cells (1:M0; 2:M2; 3:M2 Reprogrammed; 4:M1). (D) Cell viability staining (Green: Live; Red: Dead) of the cells-laden DSG hydrogels after 3 days. Scale bar:100 μm. Data are presented as means ± standard deviations (n = 3). *p< 0.001.
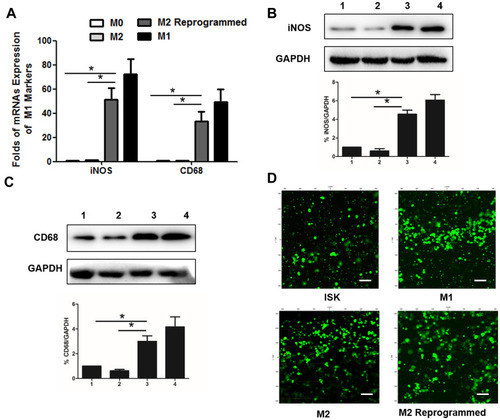
Figure 5 VEGF concentration measured by ELISA from the five models (A). The qualified oxygen saturation via oxoplates sensors of the 3D cell model system. The relative oxygen level for the six different complexes using 5×10³ macrophages and/or 1×10⁴ tumor cells. The relative oxygen saturation of co-culture growth in spheroid systems (B). Data are presented as means ± standard deviations (n = 3).*p< 0.05, **p< 0.01.
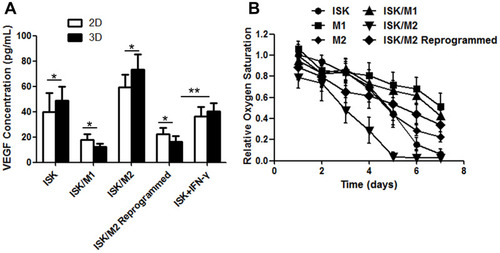
Figure 6 Reprogram M2 macrophages inhibited cell migration in a Transwell assay. The stained cells that accumulating at the bottom side of the Transwell membrane observed under a microscope (A). Quantification of the migrating cancer cells in different models (B). Scale bar:100μm. Data are presented as means ± standard deviations (n = 3). *p < 0.01.
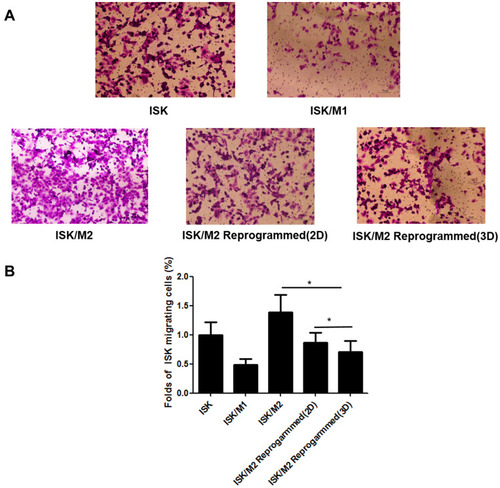
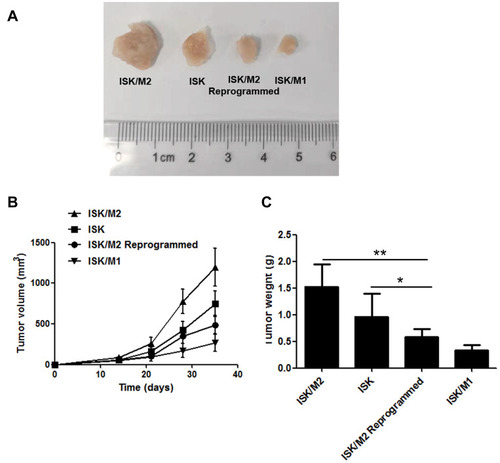
Figure 7 Reprogram M2 macrophages from the 3D hydrogels reducing tumor growth in vivo. The released cells were transplanted subcutaneously into the rear of six-week-old BABL/c nude mice. Photographs of the dissected xenograft tumors from various groups treated as indicated (A). Kinetics of tumor growth from various groups treated as indicated (B). Statistical analysis of the tumor weight of different models (C). Data are presented as means ± standard deviations (n = 5). *p < 0.05, **p<0.01.