
Figures & data
Table 1 Nanoparticle Concentrations in vitro
Figure 1 Chemical structure and characterization of DEAE12-CH-PEG-FA2 modified CH. DEAE12-CH-PEG-FA2 chemical structure (left-top). 1H-NMR spectrum of deacetylated CH (right-top panel, DDA 97.4%), DEAE12-CH (middle panel) and DEAE12-CH-PEG-FA2 (right-bottom panel). DEAE12-CH-PEG-FA2 properties (right-bottom).
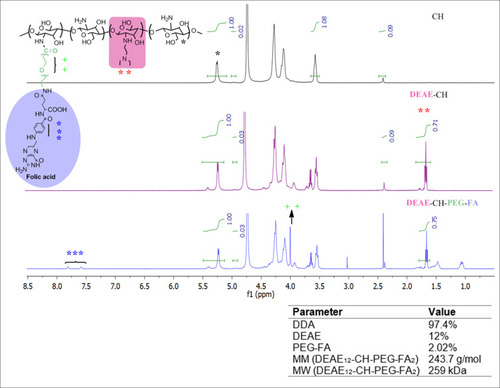
Figure 2 Characterization of DEAE12-CH-PEG-FA2/siRNA nanoparticles in DPBS pH 7.2. Nanoparticles had DEAE12-CH-PEG-FA2/siRNA N/P ratios of 5:1, 10:1, 15:1, 20:1, 30:1 and 40:1. (A) Nanoparticles agarose electrophoresis using 0.5 μg of siRNA/well. Lane 1: ladder (1kb pairs); lane 2 free siRNA; lane 3–8: DEAE12-CH-PEG-FA2/siRNA nanoparticles at the indicated N/P ratios. (B) Nanoparticle size and PDI with 0.02 mM of siRNA/optical-cell. (C) Zeta potential of nanoparticles at the indicated N/P ratios. (D) Nanoparticle size vs time and (E) their corresponding PDI. All values are expressed as the mean ± SEM of two independent experiments.
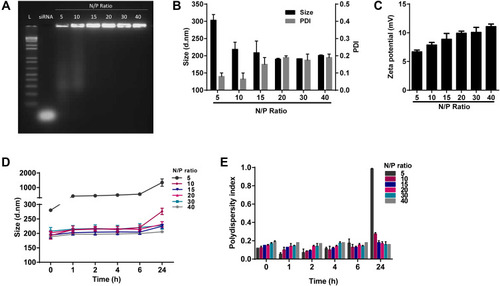
Figure 3 Cell viability and toxicity of DEAE12-CH-PEG-FA2/siRNA nanoparticles. The cytotoxic effect of nanoparticles was evaluated using the MTS (A, C, E) and LDH assays (B, D, F) in MG-63 cells, Raw 264.7 macrophage cells and PBMC. Cells were incubated with samples for 4, 24 and 48 h at 37°C. After the exposure time, MTS and LDH tests were performed. DPBS was used as the negative control. 500 μM H2O2 and 1% v/v triton X-100 were used as positive controls for MTS and LDH assays, respectively. *p<0.05, **p<0.01, ***p<0.001, ****p<0.0001 are significantly different from the negative control. Data are expressed as the mean ± SEM of three independent experiments and were analyzed by Two-way ANOVA (post hoc Dunnett’s test). Blood samples for PBMC were collected from three different healthy human donors. See for DEAE12-CH-PEG-FA2 and siRNA concentrations.
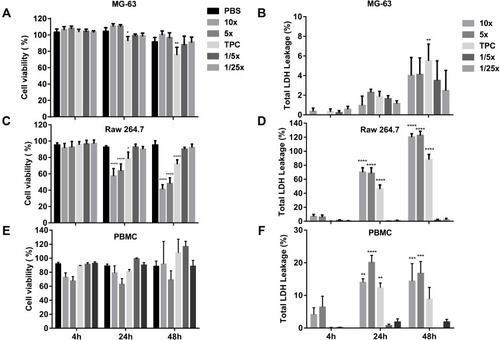
Figure 4 Hemocompatibility of DEAE12-CH-PEG-FA2/siRNA nanoparticles. (A) Hemolysis percentage induced by nanoparticles and visual inspection of tubes after the centrifugation step (inset). Human blood was incubated with samples for 3 h at 37°C. DPBS and triton represent the negative and positive controls, respectively. Pink dash line shows the 5% threshold of ASTM from which a sample is considered to have hemolytic properties. Data are expressed as the mean ± SEM of three independent experiments and were analyzed by One-way ANOVA (post hoc Dunnett’s test). (B) Nanoparticle platelet aggregation profiles after platelet-rich plasma was incubated with samples for a 6 min run at 37°C. PBS and collagen represent the negative and positive controls, respectively. Data are expressed as the mean ± SEM of three independent experiments and were analyzed by One-way ANOVA (post hoc Dunnett’s test). (C) Hemagglutination activity produced by nanoparticles in an erythrocyte suspension after 1 h of incubation at 37°C. DPBS and lectin represent the negative and positive controls, respectively. Pictures represent one of three independent experiments with similar results. The agglutination analysis was performed as described in the methods. (D) Effect of particles on plasma coagulation times: prothrombin time (PT), thrombin time (TT) and activated partial thromboplastin time (APTT). Measures were taken after a 30 min incubation of human plasma with samples at 37°C. The normal coagulation time limits are indicated with a colored dash line (PT 11 ≤ 15s (dark blue), TT 14 ≤ 21s (gray) and APTT 28 ≤ 40s (light green)). Non-treated plasma and DPBS were used as internal controls for the test. Data are expressed as the mean ± SEM of four independent experiments and were analyzed by Two-way ANOVA (post hoc Dunnett’s test). (E) Complement activation assay showing the expression levels of a native C3α chain (~115 kDa) and its cleavage product C3c (~43 kDa), after human plasma exposure to nanoparticles for 30 min at 37°C. DPBS and CVF represent the negative and positive controls, respectively. Transferrin (~77 kDa) was used as a serum loading control. Blots represent one of three independent experiments with similar results. For all experiments, blood samples were collected from at least three healthy human donors. ****p<0.0001 are significantly different from the negative control. See for DEAE12-CH-PEG-FA2 and siRNA concentrations.
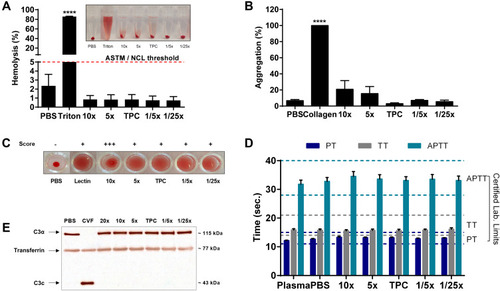
Figure 5 Nanoparticle potential to induce cytokines. (A) TNF-α, (B) IL-6, (C) IL-8, (D) IL-1β, (E) IL-10, and (F) IL-4 cytokines were detected by ELISA, after PBMC incubation with nanoparticles for 24 h at 37°C. DPBS and LPS (20 ng/mL) were used as negative and positive controls, respectively. Data are expressed as the mean ± SEM of five independent experiments, each one from a different healthy human donor, except for IL-4 where N=4. *p<0.05, **p<0.01, ****p<0.0001 are significantly different from the negative control. Data were analyzed by One-way ANOVA (post hoc Dunnett’s test). See for DEAE12-CH-PEG-FA2 and siRNA concentrations.
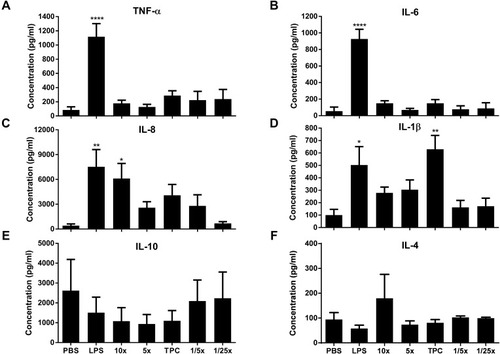
Figure 6 Nitric oxide (NO) and reactive oxygen species (ROS) production in response to nanoparticles. (A) NO concentration produced by Raw 264.7 macrophage cells in response to nanoparticles. Cells were incubated with samples for 48 h at 37°C. NO2− concentration was measured in cell supernatants using the Greiss reagent. DPBS and LPS (100 ng/mL) were used as negative and positive controls, respectively. Data were analyzed by One-way ANOVA (post hoc Dunnett’s test). (B) ROS induction by nanoparticles in Raw 264.7 cells. Cells were exposed to samples for 6 h, after pre-incubation with 20 μM of DCFH-DA probe. Fluorescence readings (ex. 485 nm and em. 530 nm) were performed at the indicated time points. 500 μM H2O2 and 5 mM DEM were used as positive controls. DPBS in blue represents the negative control. Data were analyzed by Two-way ANOVA (post hoc Dunnett’s test). Data from NO and ROS are expressed as the mean ± SEM of three independent experiments. *p<0.05, **p<0.01, ****p<0.0001 are significantly different from the negative control. See for DEAE12-CH-PEG-FA2 and siRNA concentrations.
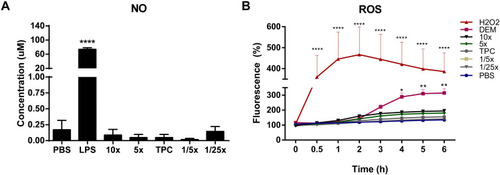
Table 2 Toxicological Screening Guidelines