Figures & data
Figure 1 Structures of evodiamine (A) and rutaecarpine (B).
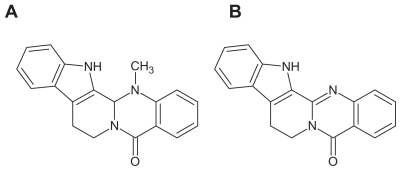
Table 1 Compositions and drug loadings of microemulsions ME1–ME9
Figure 2 Pseudoternary phase diagrams of microemulsions with ethyl oleate as the oil phase. (A) represents the pseudoternary phase diagrams of microemulsions with Tween®-80 as surfactant (S) and ethanol as cosurfactant (Cos); (B) represents the pseudoternary phase diagrams of microemulsions with Cremophor® EL as surfactant and ethanol as cosurfactant (Cremophor EL/ethanol, S/Cos); (C) represents the pseudoternary phase diagrams of microemulsions with Cremophor EL as surfactant and polyethylene glycol 400 as cosurfactant (Cremophor EL/PEG400, S/Cos); Km represents the weight ratios of surfactant to cosurfactant.
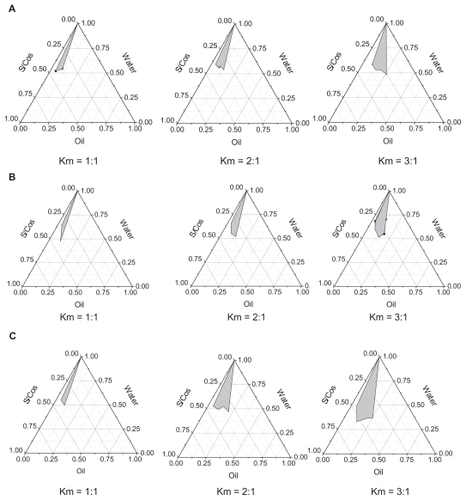
Table 2 Microemulsion characteristics and skin permeation rates of evodiamine and rutaecarpine (mean ± standard deviation, n = 3)
Figure 3 Transmission electron microscopy of evodiamine and rutaecarpine-loaded microemulsion ME2.
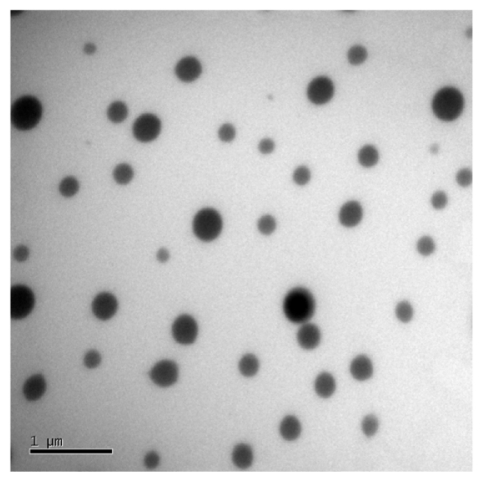
Figure 4 Ex vivo rat skin permeation profiles of evodiamine (A) and rutaecarpine (B) from microemulsions (n = 3).
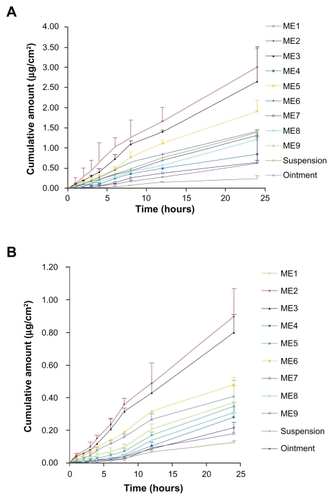
Figure 5 Ex vivo rat skin permeation profiles of evodiamine (a) and rutaecarpine (b) from microemulsions with different drug loadings (n = 3).
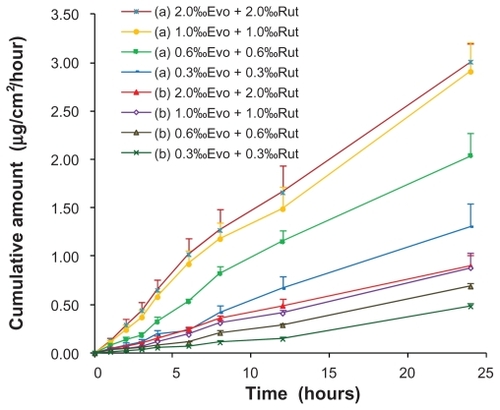
Figure 6 Ex vivo rat skin permeation rates of evodiamine (Evo) and rutaecarpine (Rut) from microemulsions with different water content (n = 3).
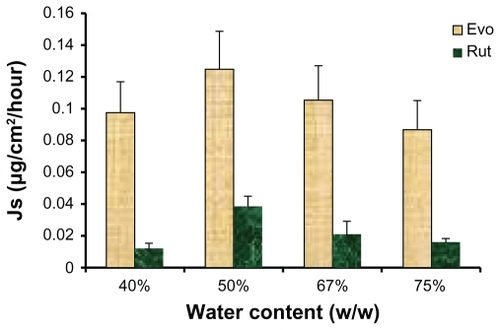
Figure 7 Ex vivo rat skin permeation rates of evodiamine (A) and rutaecarpine (B) from microemulsions in the presence of various volatile oils (n = 3).

Figure 8 Ex vivo rat skin permeation rates of evodiamine (Evo) and rutaecarpine (Rut) from microemulsions in the presence of azone (n = 3).
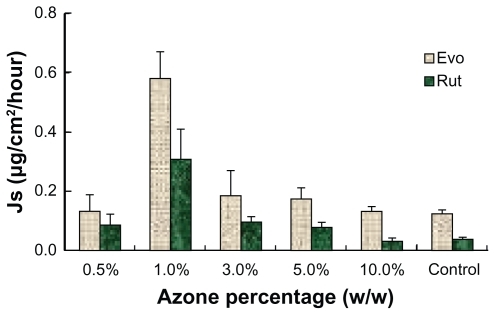
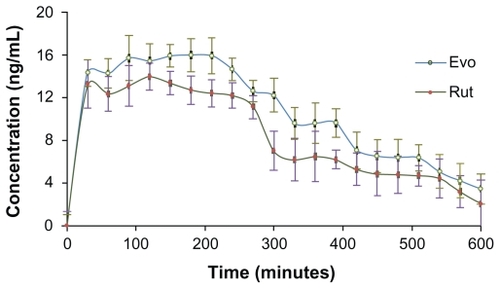
Figure 9 Time course of evodiamine (A) and rutaecarpine (B) concentrations sampled after the administration of drug-containing microemulsion, ointment, and tincture on the abdominal skin of Sprague-Dawley rats over 10 hours (n = 5).
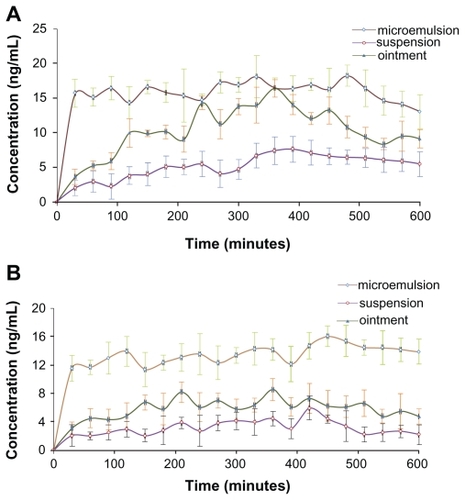
Table 3 Cutaneous pharmacokinetic parameters of evodiamine and rutaecarpine from various formulations in rats (mean ± standard deviation, n = 5)
Table 4 Cutaneous pharmacokinetic parameters of evodiamine and rutaecarpine from various skin regions in rats (mean ± standard deviation, n = 5)
Figure 10 Time course of evodiamine (A) and rutaecarpine (B) concentrations sampled after microemulsion administration on the abdomen, shoulder, and chest regions of Sprague-Dawley rats over 10 hours (n = 5).

Figure 11 Time course of evodiamine (Evo) and rutaecarpine (Rut) concentrations sampled after drug microemulsion administration (removed after 3 hours) on the abdominal skin of Sprague-Dawley rats over 10 hours (n = 5).