Figures & data
Table 1 Nucleotide primers used for reverse transcription polymerase chain reaction
Figure 1 Scanning electron microscope images of the electrospun pure polylactide (PLA) and poly(ethylene glycol) (PEG)/PLA hybrid membrane. (A) Pure PLA, 500×; (B) pure PLA, 1000×; (C) PEG/PLA, 500×; and (D) PEG/PLA, 1000×.
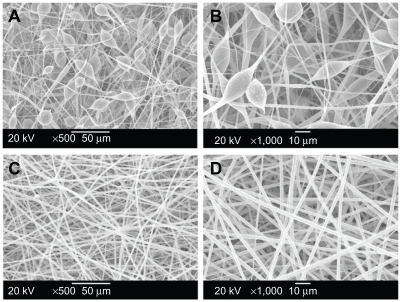
Figure 2 Scanning electron microscope observations of rat bone mesenchymal stem cell adhesion and growth on the electrospun poly(ethylene glycol)/polylactide hybrid membranes for 1 day (A, B), 3 days (C, D), and 5 days (E, F) at different magnification (A, C, E: 500×; B, D, F: 1000×).
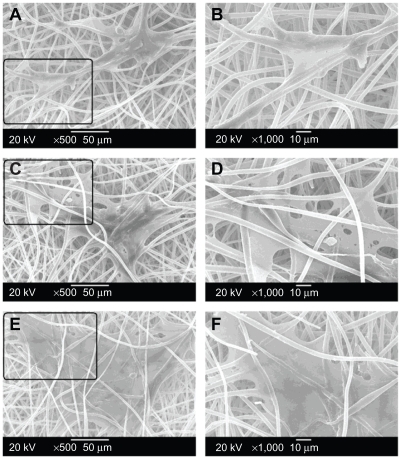
Figure 3 Mesenchymal stem cells viability and metabolic activity evaluation on the poly(ethylene glycol)/polylactide hybrid membranes, with the tissue culture plate as the control.
Note: Error bars represent standard deviation; n = 3.
Abbreviations: PEG/PLA, poly(ethylene glycol)/polylactide; OD, optical density.
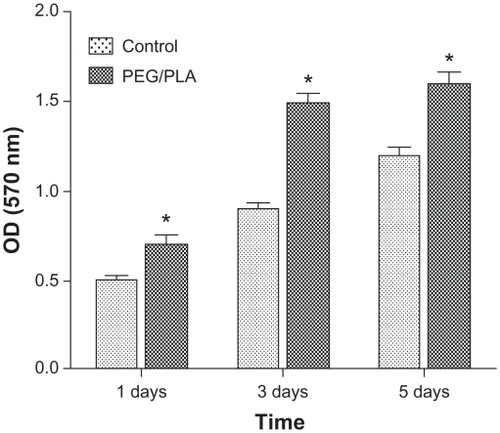
Figure 4 Fluorescence micrographs show the cytocompatibility of the poly(ethylene glycol)/polylactide electrospun fibrous scaffolds with mesenchymal stem cells (C, D). Mesenchymal stem cells cultured on the tissue culture plate were the control (A, B). The cells were stained with fluorescein diacetate in green color (A, C) and 2-(4-amidinophenyl)-6-indolecarbamidine dihydrochloride for cell nuclei in blue (B, D). Mesenchymal stem cells on the poly(ethylene glycol)/polylactide electrospun fibrous scaffolds under white light were also included at different magnification (E, F).
Note: Scale bar = 100 μm.
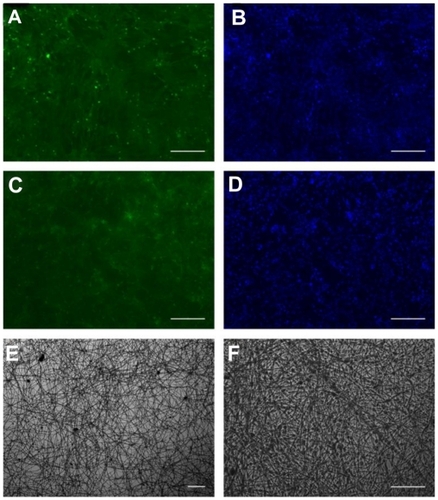
Figure 5 Graphical summary of the three phases and time schedule of osteogenic induction: proliferation, matrix maturation, and mineralization.
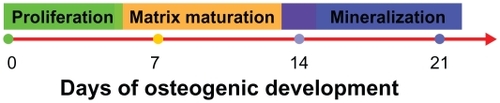
Figure 6 Gene expression profile of rat bone mesenchymal stem cells in osteogenic cultures. (A) Agarose gel electrophoresis result of the real-time polymerase chain reaction product shows the effects of the culture scaffold on gene expression on day 7, 14, and 21. (B) Quantitative analysis for Col I, Cbfa-1, OCN, and OPN expression was performed by Gene Expression Analysis for iCycler iQ® Real-Time PCR Detection System (Bio-Rad Laboratories, Hercules, CA); relative gene expression levels were normalized by the housekeeping gene, β-actin.
Note: *Represents statistically significant difference (P < 0.05), n = 3.
Abbreviation: PEG/PLA, poly(ethylene glycol)/polylactide.
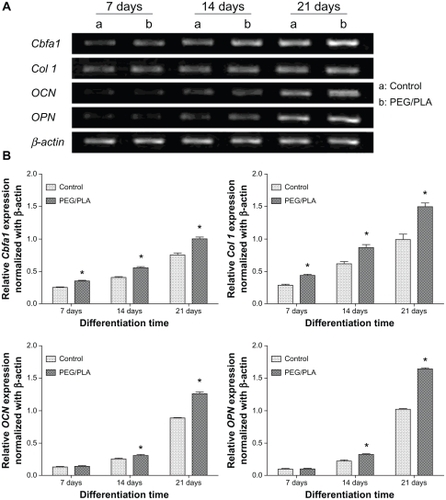
Figure 7 Alkaline phosphatase activity expressed by the cells after culturing for 4, 7, 14, and 21 days. A glass coverslip was used as a fiber-supporting substrate and data on the glass coverslip was included as a control. (A) Alkaline phosphatase activity quantitative evaluation on day 4, 7, 14, and 21. Alkaline phosphatase staining was also performed on control (B) and poly(ethylene glycol)/polylactide hybrid scaffolds (C) on day 14.
Notes: Scale bar = 50 μm.*Represents statistically significant difference (P < 0.05), n = 3.
Abbreviations: PEG/PLA, poly(ethylene glycol)/polylactide; pNP, p-nitrophenyl phosphate.
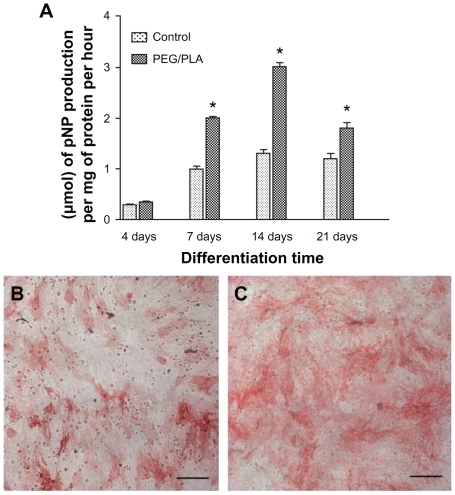
Figure 8 Analysis of the mineral deposition in osteogenic mesenchymal stem cells on day 21 by Alizarin Red S staining. Photographs of the Alizarin Red S staining show higher calcium deposition of the poly(ethylene glycol)/polylactide fibrous scaffolds with a glass coverslip as the fiber-supporting substrate (A) than on the glass coverslip as control (B). The quantification result confirmed the higher Alizarin Red S staining of the poly(ethylene glycol)/polylactide fibrous scaffolds (C).
Note: *Represents statistically significant difference (P < 0.05), n = 3.
Abbreviations: PEG/PLA, poly(ethylene glycol)/polylactide; OD, optical density.
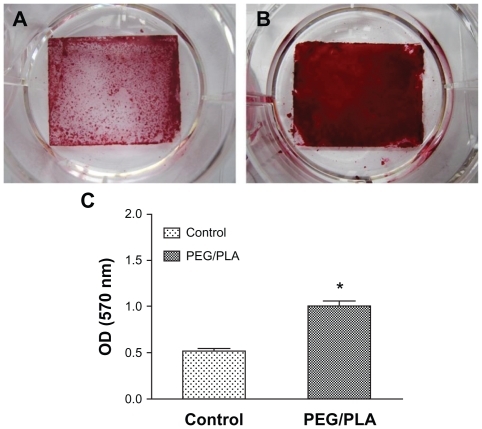
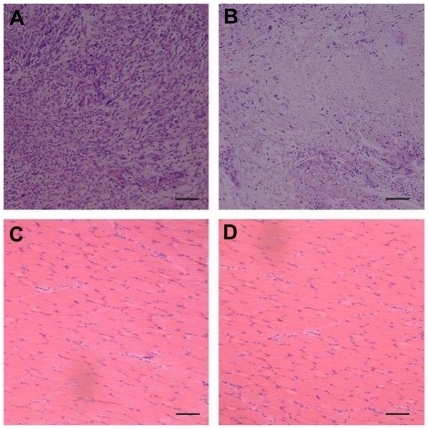
Figure 9 Histologic analysis of tissue response to poly(ethylene glycol)/polylactide fibrous scaffolds. There was a dense accumulation of inflammatory cells presented around the poly(ethylene glycol)/polylactide fibrous scaffolds at 2 weeks (A) but attenuated at week 4 (B). Meanwhile, the surrounding muscle presented good physiological characteristics both at 2 weeks (C) and 4 weeks (D).
Note: Scale bar = 50 μm.