Figures & data
Figure 1 (A) Nitrogen adsorption/desorption isotherms (1) and pore size distribution (2) by the Barrett–Joyner–Halenda (BJH) analysis of S, S3, and FS3. (B) X-Ray Diffraction (XRD) intensity measurements of F, FS3, and FS3P-A. (C) Magnetic hysteresis loops of F, FS3P, FS3P-G, and FS3P-A; photographs of (1) Fe3O4 NPs and (2) FS3P-A NPs before and after separation with an external magnetic field.
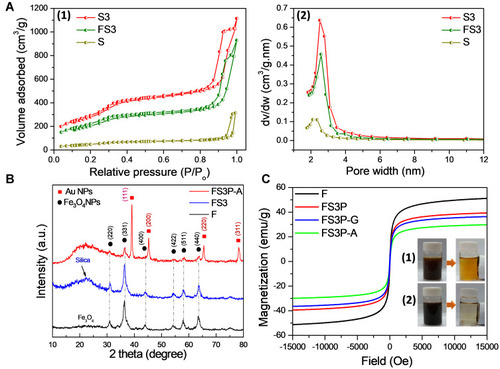
Figure 2 (A) FT-IR spectra of (1) S, (2) FS3, (3) FS3P, and (4) FS3P-G. (B) SEM image and inset TEM image of Fe3O4 (F) (1), SEM image of FS3 (2), SEM image of FS3P (3), SEM image and inset TEM image of FS3P-A (4); TEM images of S (5), and TEM images of FS3P (6).
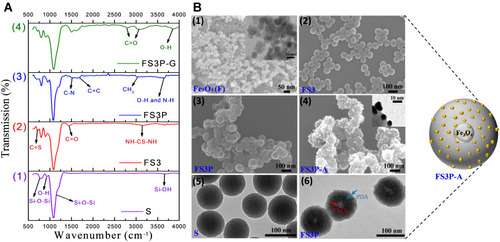
Figure 3 (A) Temperature-variation curves of S, S3P-G/C, FS3P-G/C, S3P-A/C, and FS3P-A/C, solutions during the exposure to an 808 nm laser at a power density of 1.5 W/cm2 for 10 minutes; (B) cisplatin release profiles from SP/C, FS3P-G/C, and FS3P-A/C in PBS at pH 7.4 and pH 5.5; (C) cumulative cisplatin release from FS3P-G/C and FS3P-A/C in PBS at pH 5.5 without and with NIR irradiation (808 nm laser, 1.5W/cm2) for 10 minutes; the dotted lines shown in (C) indicate the temperature change of in-vitro solution induced by the irradiation of NIR light for 10 minutes; (D) mechanism of stimuli pH/NIR responsive controlled release from FS3P-G/C (1) and FS3P-A/C (2).
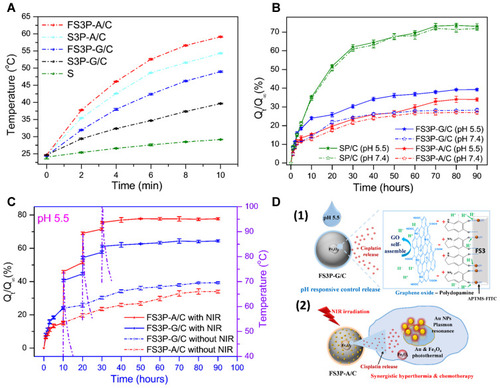
Table 1 Summary of Drug Release Data for Each Type of Particles Under Different Conditions of Time vs pH and NIR Irradiation
Figure 4 Confocal microscopy imaging and flow cytometry analysis of HeLa cells after incubation with as-prepared samples: (A) SP/C, (B) FS3P-G/C, (C) FS3P-A/C, and (D) FS3P-G-E/C.
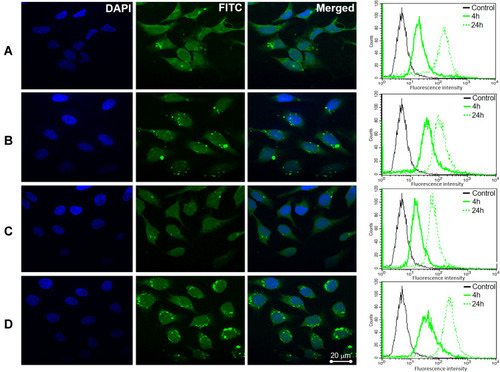
Figure 5 Thin-section TEM images of cell incubated with magnetic mesoporous silica nanoparticles. (A) Control cells without nanoparticles, (B) SP/C, (C) FS3P-G/C, (D) FS3P-A/C, and (E) FS3P-G-E/C. Arrows denote metal oxide particles or particulate matter.
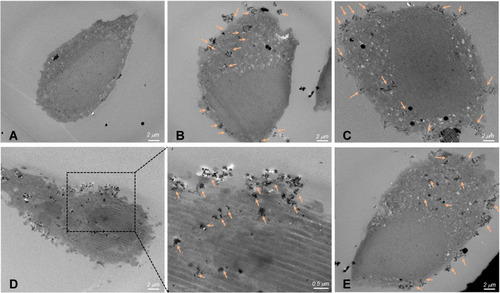
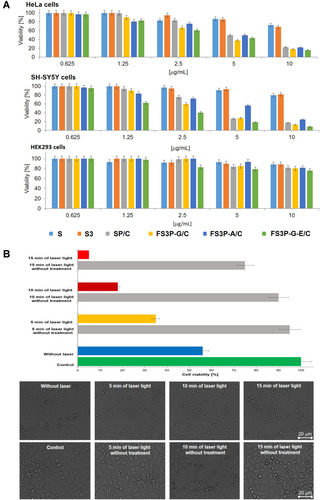
Figure 6 (A) Cytotoxicity against HeLa, SH-SY5Y, and HEK293 cells lines induced by different nanoparticles S, S3, SP/C, FS3P-G/C, FS3P-A/C, and FS3P-G-E/C at their concentrations ranging from 0.625 to 10 µg/mL. (B) Cell viability of HeLa cells (the up panel) and their morphological observation (the down panel) incubated with or without FS3P-A/C (concentration 5 μg/mL) with or without 808 nm NIR laser irradiation at 1.5 W/cm2 for 5, 10, and 15 minutes.
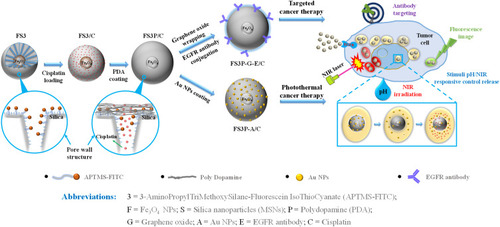
Scheme 1 Schematic illustration of core-shell FS3, double layer coating by PDA and Au coating (FS3P-A/C), Graphene oxide wrapping and EGFR antibody conjugating (FS3P-G-E/C); mechanism of stimuli pH/NIR responsive controlled release; and biomedical application through Au/Fe3O4/PDA photothermal therapy, the magnetically guided and EGFR antibody target.