Figures & data

Figure 1 Synthesis and characteristics of a self-assembling IGF-1C hydrogel. (A) Chemical structure of the self-assembling IGF-1C hydrogel. (B) Frequency-dependent rheological analysis of self-assembling IGF-1C hydrogel. (C) Circular dichroism (CD) spectra of the self-assembling IGF-1C hydrogel compared with that of an unassembled one. (D) Optical images of unassembled IGF-1C (solution) versus assembled IGF-1C (hydrogel) in the phosphate buffered solution (PBS) buffer solvent (pH=7.4). (E) Surface plasmon resonance (SPR) response units of the β-IGF-1C hydrogel with recombinant human IGF-1 receptor. (F) Transmission electron microscopy (TEM) image of the ultrastructure of β-IGF-1C hydrogel. Scale bar=500 nm.
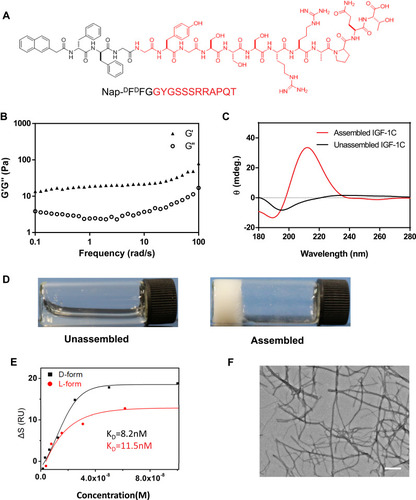
Figure 2 Biocompatibility of the β-IGF-1C hydrogel. (A) Cell Counting Kit 8 (CCK-8) assay demonstrating the optical density (OD) values of human placenta-derived mesenchymal stem cells (hP-MSCs) in the presence of the β-IGF-1C hydrogel at diverse concentrations (0–200 nM). *P<0.05 versus Control. (B) Bioluminescence living imaging (BLI) image of Fluc-hP-MSCs cultured with β-IGF-1C hydrogel (100 nM) at different time points (12 and 48 hours) (C) Quantitative analysis of firefly luciferin (Fluc) signal intensity. Data are expressed as the means ± SEM. *P<0.05 versus Control. (D) Optical images of tube formation of Human umbilical vein endothelial cells (HUVECs). Scale bar=100 μm. (E) Quantitative evaluation of nodes by using Image J software. Data are expressed as the mean ± SEM. *P<0.05 versus Control.
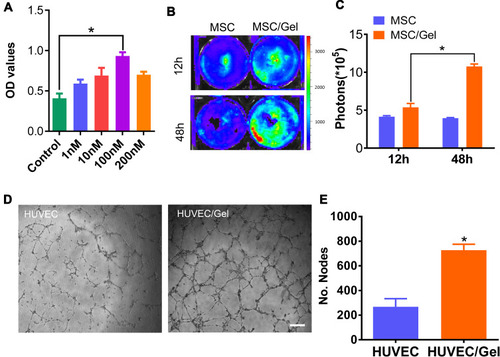
Figure 3 Improvement of cell engraftment. (A) Bright field image of human placenta-derived mesenchymal stem cells (hP-MSCs). Scale bar=50 μm. (B) Firefly luciferin (Fluc) activities of labeled hP-MSCs. The experiment was performed in triplicate. (C) Correlation between cell numbers and Fluc expression. (D) Longitudinal tracking of labeled cell fate over a 9-day period in a murine acute kidney injure (AKI) model via bioluminescence living imaging (BLI). (E) Quantification of the time-dependent Fluc signal dynamics, as an equivalent of cell retention. Data are expressed as the mean ± SEMs, *P<0.05 versus hP-MSCs.
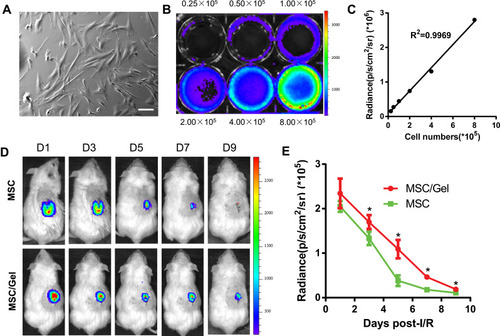
Figure 4 Ameliorated renal repair post-injury. (A) Histological assay by Hematoxylin and Eosin (HE), periodic acid-Schiff (PAS) staining revealing the repair process at day 3 post-acute kidney injure (AKI). n=5 for each group. Scale bar=50 μm. (B) HE and (C) PAS semiquantitative histological assessment via acute tubular necrosis (ATN) scoring. (D) Blood urea nitrogen (BUN) and (E) serum creatinine (SCr) levels as indicators of renal function were detected at day 1 post-injury. (F) Representative images of kidney injure molecular-1 (KIM-1) and Ki-67 immunofluorescence staining on day 3. Scale bar=50 μm. Lotus Tetragonolobus Lectin (LTL) was stained as a marker of proximal tubular epithelial cells, while nuclei were counter stained with 4, 6-diamino-2-phenyl indole (DAPI). Scale bar=50 μm. (G) Integrated optical density (IOD) values for KIM-1 and (H) Ki-67. All data mentioned above are expressed as the mean ± SEM. $P<0.05 versus phosphate buffered solution (PBS); #P<0.05 versus human placenta-derived mesenchymal stem cells (hP-MSCs); *P<0.05 versus β-IGF-1C; &P<0.05 versus β-IGF-1C+hP-MSCs. (I) Western blot analysis of phosphorylated IGF-1 receptor of hP-MSCs with or without β-IGF-1C treatment.
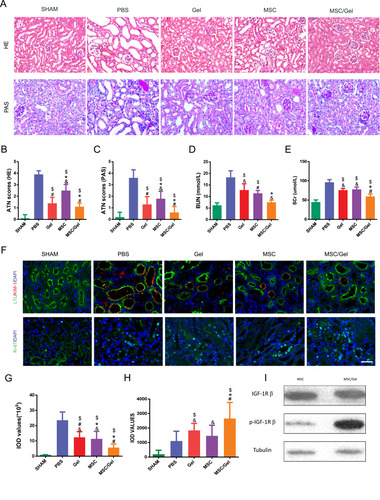
Figure 5 Attenuated renal fibrosis. (A) Representative images of kidney sections stained for Masson trichrome and immunofluorescence images of collagen Ⅳ at day 28 after acute kidney injure (AKI), while nuclei were counter stained with 4, 6-diamino-2-phenyl indole (DAPI). Scale bar=50 μm (upper panel) or, 100 μm (lower panel). (B) Semiquantitative analysis of Masson staining via Image J software. (C) Integrated optical density (IOD) values of collagen Ⅳ, as an equivalent to kidney fibrosis. Data mentioned above are expressed as the mean ± SEM. $P<0.05 versus phosphate buffered solution (PBS); #P<0.05 versus human placenta-derived mesenchymal stem cells (hP-MSCs); *P<0.05 versus β-IGF-1C; &P<0.05 versus β-IGF-1C+hP-MSCs.
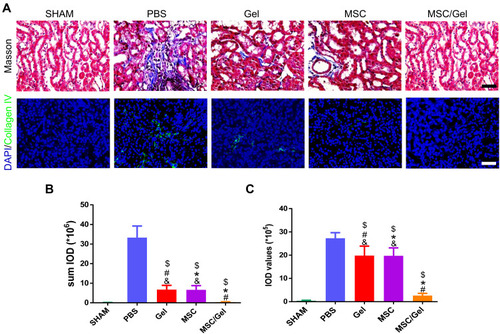
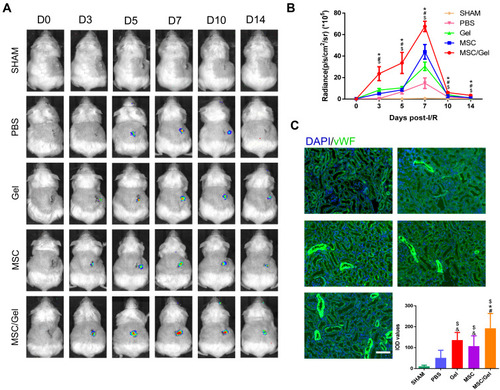
Figure 6 Accelerated angiogenesis in vivo. (A) In vivo bioluminescence living imaging (BLI) tracking of spatiotemporal kinetics of vegfr2 expression in murine acute kidney injure (AKI) model. (B) Quantification of vegfr2 expression by BLI. n=5 for each group. Data are expressed as the mean ± SEM. $P<0.05 versus phosphate buffered solution (PBS); #P<0.05 versus human placenta-derived mesenchymal stem cells (hP-MSCs); *P<0.05 versus β-IGF-1C; &P<0.05 versus β-IGF-1C+hP-MSCs. (C) Representative images and integrated optical density (IOD) values of von Willebrand factor (vWF) immunofluorescence staining of ischemic tissue at day 3, while nuclei were counter stained with 4, 6-diamino-2-phenyl indole (DAPI). Scale bar=100 μm.