Figures & data
Figure 1 Characterization of Ti and the contents of Ti in organs. (A and B) Scanning electron microscopy and transmission electron microscopy images of Nano-TiO2. The powder was deposited on 200-mesh copper grids. The particle primary structure was 10–30 nm and globular. (C) On the 7th day after instillation, the contents of Ti in tissues of rats in the 0, 0.2, and 1 g/kg Nano-TiO2 treatment groups. N=5, *P<0.05, in comparison to the control group. (D) The contents of Ti in tissues of rats after 1 g/kg Nano-TiO2 treatment for 1, 3, and 7 days. N=5, *P<0.05, in comparison to the 1-day group.
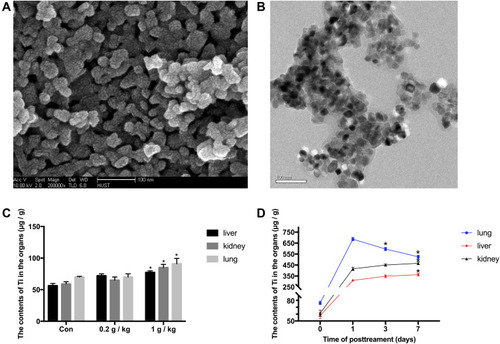
Figure 2 Effects of Nano-TiO2 exposure on the histopathological changes in the lung, liver, and kidney at 7 days after treatment. (A) The representative images of lung tissue of rats stained with HE. (B) The representative images of liver tissue of rats stained with HE. (C) The representative images of kidney tissue of rats stained with HE. Scale bar represents 50 μm. The arrow in A2 indicated irregular luminal inflammatory cell infiltration; The arrow in A3indicated the alveolar wall thickening. The arrow in B2 indicated cell disorder. The arrow in B3 indicated the spotty necrosis. The arrow in C2 indicated the gap increases. The arrow in C3 indicated necrosis. 1: Control group, 2: 0.2 g/kg group, 3: 1 g/kg group.
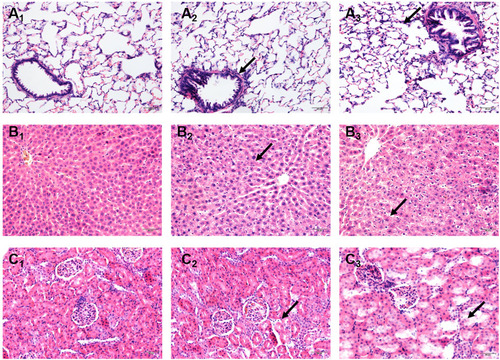
Figure 3 The oxidative stress levels in the lung, liver, and kidney of rats after Nano-TiO2 treatment. (A–C) The SOD, GSH-Px activities, and MDA content in lung of rats. (D–F) The SOD, GSH-Px activities, and MDA content in liver of rats. (G–I) The SOD, GSH-Px activities, and MDA content in kidney of rats. (J–L) ROS levels induced by Nano-TiO2 in organs of rats. N=5, *P<0.05, in comparison to the control group; #P<0.05, in comparison to the 0.2 g/kg group.
Abbreviations: SOD, superoxide dismutase; GSH-Px, glutathione peroxidase; MDA, malonaldehyde.
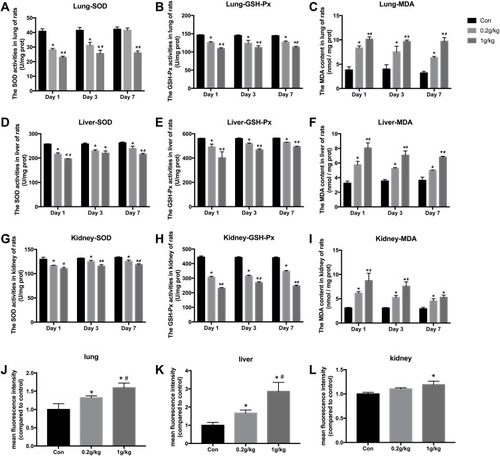
Figure 4 The DNA damage levels in the lung, liver, and kidney of rats after Nano-TiO2 treatment. (A and B): The OTM value and Tail DNA% value changed in the lung after Nano-TiO2 treatment at different times. (C and D) The OTM value and Tail DNA% value changed in the liver after Nano-TiO2 treatment at different times. (E and F) The OTM value and Tail DNA% value changed in the lung after Nano-TiO2 treatment at different times. (G) Representative images of DNA damage in the lung of rats after Nano-TiO2 treatment for 7 days (400x). (G1: control group; G2: 0.2 g/kg Nano-TiO2 treatment group; G3: 1 g/kg Nano-TiO2 treatment group). The result was the average of at least three independent experiments. N=5, *P<0.05: day 1 in comparison to the control group; #P<0.05: day 3 in comparison to the control group; ○P<0.05: day 7 in comparison to the control group.
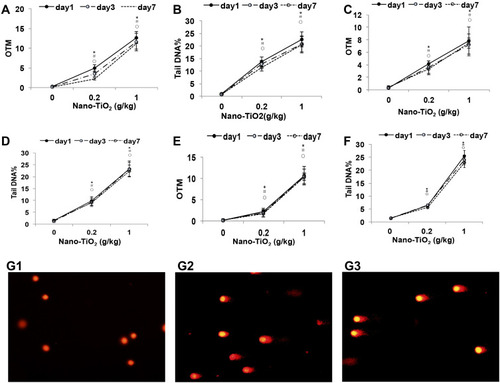
Figure 5 Activation of the PI3K-AKT-FOXO3a signal pathway in the lung, liver, and kidney of rats after Nano-TiO2 treatment for 7 days. (A) The represented protein bands of PI3K, AKT, FOXO3a, p-AKT, and p-FOXO3a in the lung. (B–D) The fold changes of PI3K, p-AKT/AKT, and p-FOXO3a/FOXO3a levels in the lung. (E–H) The represented protein bands and fold changes of PI3K, AKT, FOXO3a, p-AKT, and p-FOXO3a in the liver. (I–L) The represented protein bands and fold changes of PI3K, AKT, FOXO3a, p-AKT, and p-FOXO3a in the kidney. N=5, *P<0.05, in comparison to the control group. #P<0.05, in comparison to the 0.2 g/kg group.
Abbreviations: PI3K, phosphatidyl inositol 3-kinase; AKT, protein kinase B; FOXO3a, the Fork head box class O 3a.
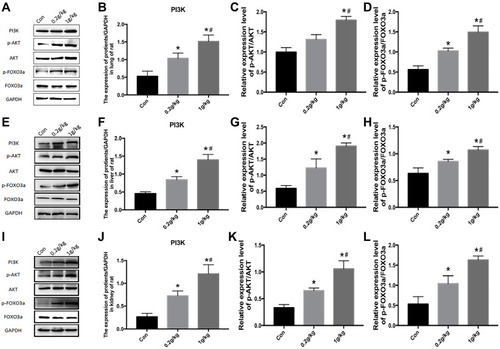
Figure 6 Changes of DNA repair proteins in the lung, liver, and kidney of rats exposed to Nano-TiO2 for 7 days. (A–D) The represented protein bands and fold changes of XRCC1, ChK2, and GADD45α in the lung. (E–H) The represented protein bands and fold changes of XRCC1, ChK2, and GADD45α in the liver. (I–L) The represented protein bands and fold changes of XRCC1, ChK2, and GADD45α in the kidney. N=5, *P<0.05, in comparison to the control group. #P<0.05, in comparison to the 0.2 g/kg group.
Abbreviations: XRCC1, x-ray repair cross complementing gene 1; ChK2, checkpoint kinase 2; GADD45α, growth arrest and DNA damage α.
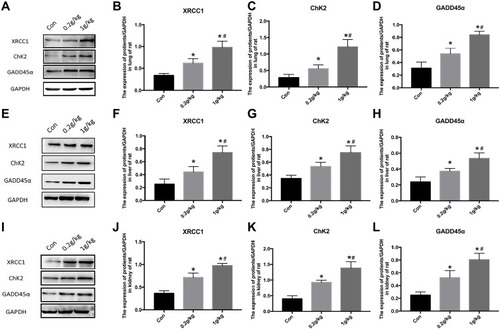
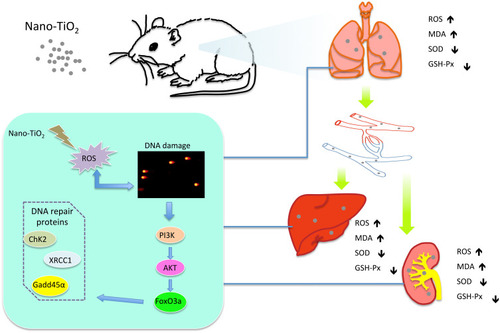
Figure 7 A proposed action model for the PI3K/AKT/FoxO3a pathway via ROS regulating DNA damage in the lung, liver, and kidney induced by Nano-TiO2 intratracheal administration.