Figures & data
Figure 1 Schematic illustration of the sampling operation for the deposition study of nebulized lipid-stabilized contrast agent on the luminal surface of ex vivo pig laryngeal and tracheal segments.
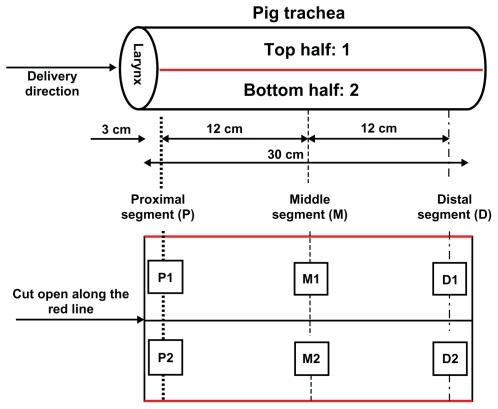
Table 1 Particle sizes and zeta potentials of the lipid-stabilized contrast agents
Figure 2 Average diameter (A), diameter distribution (B), and percentage of small droplets (C) of lipid-stabilized droplets and the control after ultrasonic nebulization. In B, the blue columns represent the volume frequency percentage and the red curve represents the cumulative volume percentage; in the cumulative volume overlay graph, pink indicates L1, black indicates L2, green indicates L3, blue indicates L4 and red indicates the control.
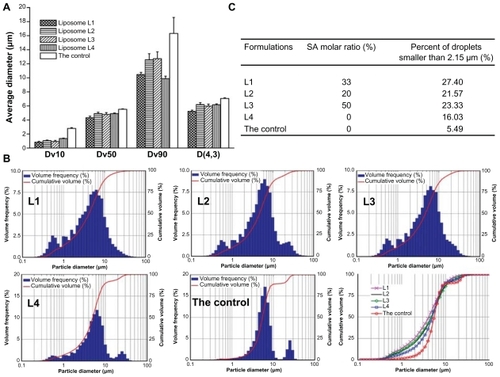
Figure 3 Gadolinium concentrations at different sites on pig tracheal luminal surfaces after nebulization delivery of lipid-stabilized contrast agent and the control.
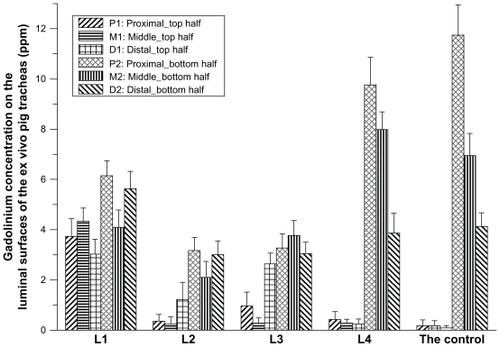
Figure 4 Transverse magnetic resonance images of ex vivo pig laryngeal (A1 and B1) and tracheal (A2 and B2) segments before and after nebulization delivery of lipid-stabilized contrast agent and the control. Left images, before nebulization; right images, after nebulization.
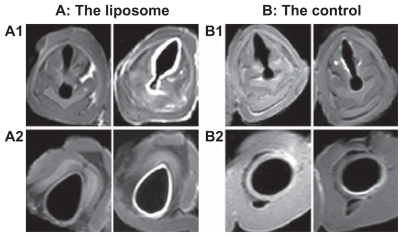
Figure 5 Transverse magnetic resonance images of ex vivo pig laryngeal and tracheal lumen in successive scanning layers after nebulization delivery of the lipid-stabilized contrast agent. In each image, the left is the larynx, and the right is the tracheal lumen.
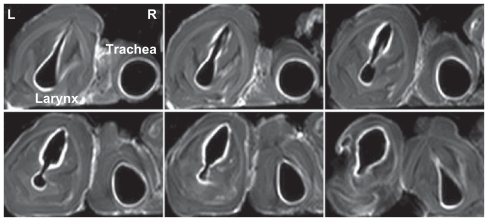
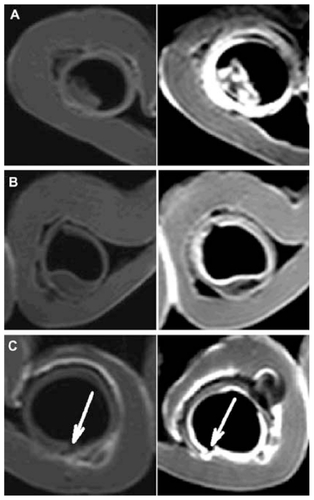
Figure 6 Transverse magnetic resonance images of three diseased tissue models before (left column) and after (right column) contrast enhancement by the nebulized lipid-stabilized contrast formulation. (A) Intraluminal protrusion, (B) submucosal nodule, and (C) submucosal crater.