Figures & data
Figure 1 Schematic diagram of the growth phases of CNP (cross-sectional view) cultured with and without FBS with corresponding SEM and LM images, and LM observation of dissolution of SF-CNP to S-CNP. A, B, and C are the forms of CNP in the presence of serum (S-CNP). (i): SEM image of S-CNP. D, E, and F are the forms of CNP in the absence of FBS (SF-CNP). (ii): LM image of apatite layers of SF-CNP. (iii): SEM image of the formation shown in (ii). G: Schema of SF-CNP when exposed to FBS, apatite layers dissolve releasing the S-CNP within 24 h. (iv): SEM image of phase G. G1–G5: A series of LM images showing the dissolution of SF-CNP apatite layers and clumps of S-CNP released, with the replenishment of FBS. Bars: (i) = 100 nm; (ii) = 5 μm; (iii) = 2 μm; (iv) =1 μm; (G1–G5) = 5 μm.
Abbreviations: CNP, calcifying nanoparticles; FBS, fetal bovine serum; LM, light microscopy; SEM, scanning electron microscopy.
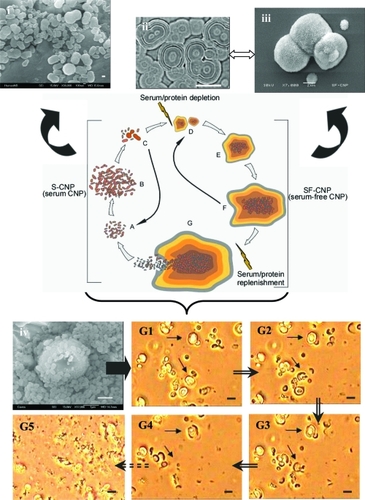
Figure 2 Optical micrograph of SF-CNP showing an increase in number over a culture period of 25 days. (A) Day 1 at 900X magnification; (B–E) Days 2, 5, 10, and 25, respectively at 300X magnification. The white arrows in each image indicate the same large SF-CNP on the same spot throughout the experiment. (F) measurements of a few SF-CNP on Day 25 at 900X magnification. All particles seen in the images are the different sizes of SF-CNP. Bars: (A) = 15 μm; (B), (C), (D), and (E) = 30 μm; (F) = 5 μm.
Abbreviation: SF-CNP, serum-free calcifying nanoparticles.
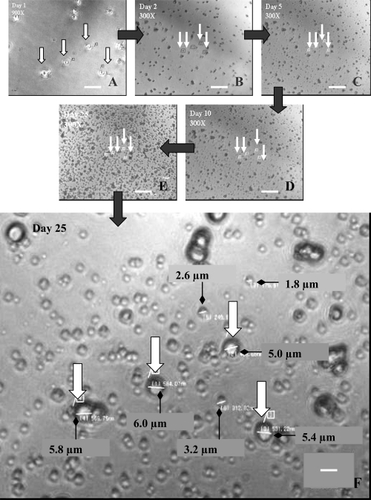
Figure 3 Electron microscopic images of SF-CNP. (A) SEM of an empty apatite “igloo” detached from the culture medium. (B) TEM section of a similar SF-CNP and its inner structure. Arrows point to the apparently budding side of the shell. Bars: (A) =1 μm; (B) = 500 nm.
Abbreviations: SEM, scanning electron microscopy, SF-CNP, serum-free calcifying nanoparticles; TEM, transmission electron microscopy.
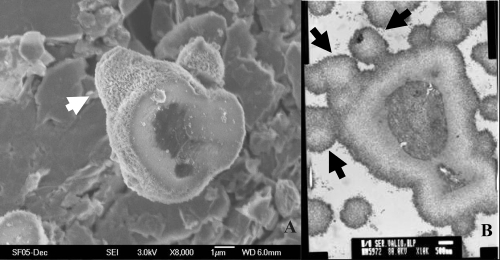
Figure 4 Time-lapse imaging and plot of SF-CNP from Day 0 to Day 5 using Nikon’s BioStation IM. Only a few intermediate images of SF-CNP on Days 0, 3, and 5 at 40X magnification are shown. The white arrows mark some large SF-CNP on the same spot throughout the experiment. Note the small SF-CNP within the square blocks showing an increase in size and number over time. A graph of SF-CNP count against time in hours shows a linear increase in the SF-CNP number. The images and graph together imply an increase in size and number of SF-CNP over a period of 5 days. Bars: (A), (B), and (C) = 15 μm.
Abbreviation: SF-CNP, serum-free calcifying nanoparticles.
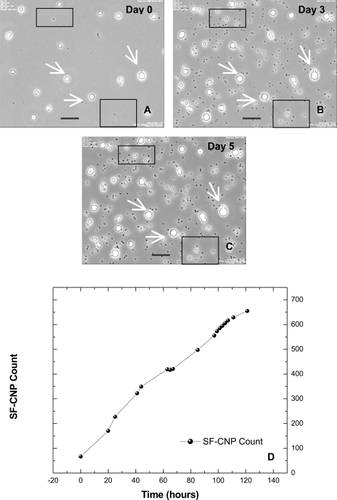
Figure 5 Time-lapse imaging and plot of S-CNP from Day 0 to Day 5 using Nikon’s BioStation IM. Only a few intermediate images of S-CNP on Days 0, 2, and 5 at 40X magnification are shown. The black arrows point to some S-CNP on the same spot throughout the experiment. Bars: (A), (B), and (C) = 15 μm.
Abbreviation: S-CNP, serum calcifying nanoparticles.
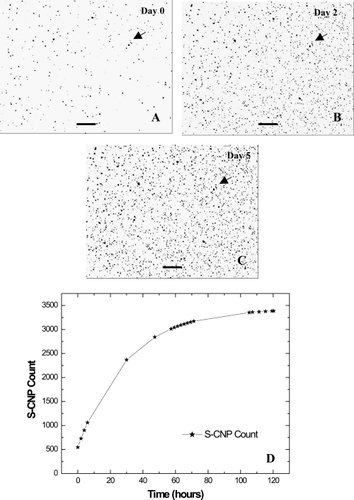
Figure 6 EDS analysis of CNP apatite. Si peak is because of the glass substrate on which CNP samples were cultured.
Abbreviations: CNP, calcifying nanoparticles; EDS, energy dispersive spectroscopy.
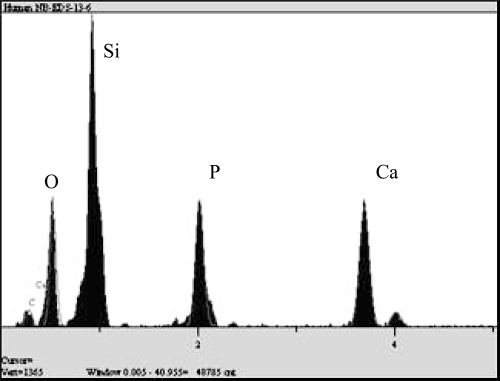
Figure 7 TEM image of “dividing” S-CNP. (A) Unique septa-like divisions (“cells” on the right, with white-small arrows). (B) A unique inner structure of CNP during division. Thick white arrows show budding-like formations, black arrows show dark stained apatite layer on the surface of CNP. Bars: 50 nm.
Abbreviations: CNP, calcifying nanoparticles; S-CNP, serum calcifying nanoparticles; TEM, transmission electron microscopy.
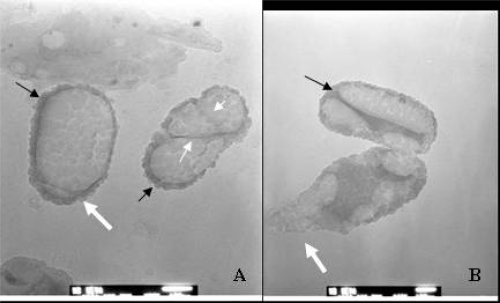
Table 1 Comparison of two self-replicators: CNP and inorganic apatite crystals