
Figures & data
Table 1 Preparation of MMF-Loaded βCD Nanoparticles Using Varying Ratios of βCD and Stearic Acid to MMF
Table 2 Composition of Selected Formulation for the Preparation of MMF-Loaded βCD Nanoparticles
Figure 1 FTIR spectra of (A) MMF, (B) stearic acid, (C) βCD and (D) MMF-loaded βCD facilitated SLNs, describing the chemical compatibilities of selected the ingredients.
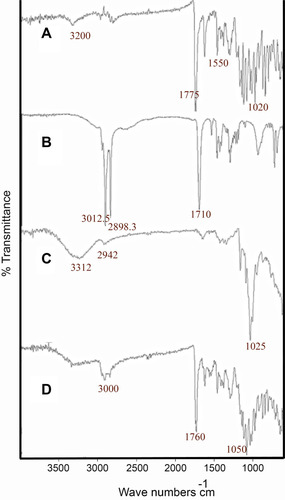
Figure 2 Zeta size and particle size distribution analysis of MMF-loaded βCD facilitated SLNs.
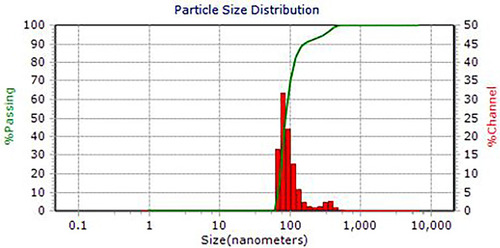
Figure 3 SEM micrograph of MMF-loaded βCD facilitated SLNs, illustrating nanosized particles with smooth spherical shape.
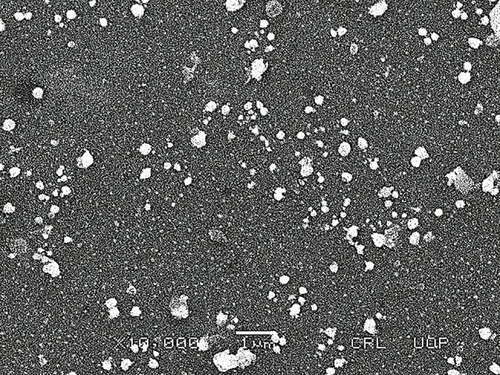
Figure 4 Calibration curve for MMF, describing linearity behavior in the selected range of concentration (2–12 µg/mL) at 254 nm.
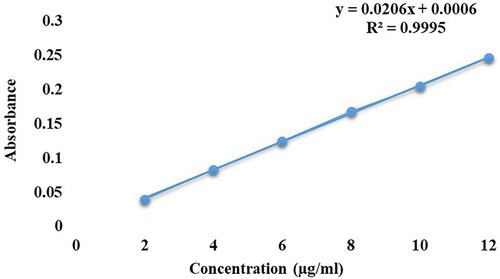
Figure 5 In vitro drug release profile of F1, F2 F3 and F4 of MMF-loaded βCD facilitated SLNs.
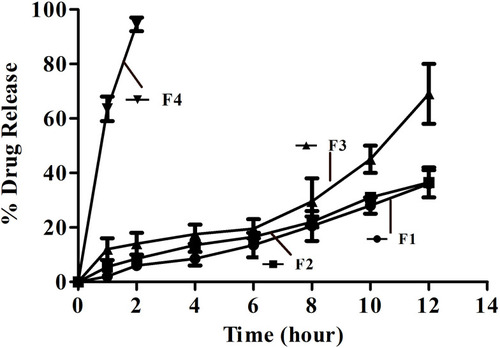
Figure 6 Graphical representation of in vitro drug release, conducted at acidic pH (1.2) and basic pH (7.2), showing sustained and controlled release of drug from MMF-loaded βCD facilitated SLNs, during 12 h of the studies.
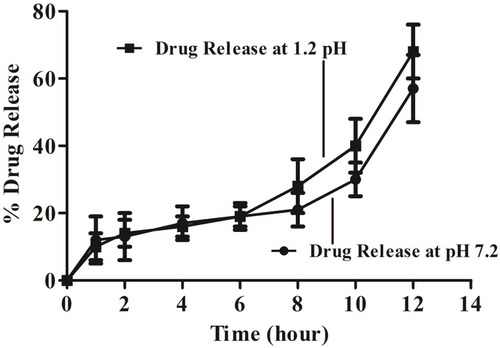
Table 3 Kinetic Modeling of the Release Data Obtain from in vitro Dissolution Studies
Figure 7 XRD diffractogram, (A) describing the crystalline nature of the drug, which has also been observed in prepared, (B) MMF-loaded βCD facilitated SLNs, while, (C) also showed some less intense peaks, attributed to crystalline βCD.
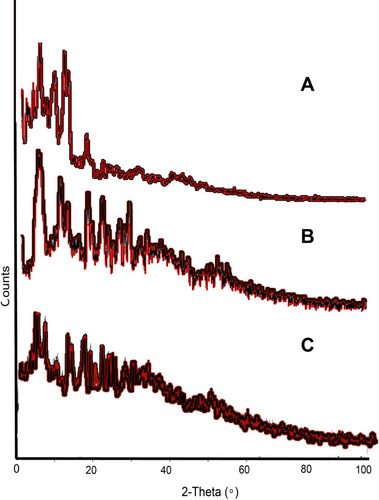
Table 4 Outcomes of Statistical Analysis