Figures & data
Table 1 The stability effect of different lipid molar ratios and L/E/W ratio formulas following the ethanol injection extrusion method
Figure 1 The mean particle size (○) and zeta potential (●) stability tests for liposome suspensions as a function of time (stored at 4°C). (A) Formula No. E and (B) formula No. F. (C) FITC-BSA-loaded lipoparticles. (D) Comparison of FITC–BSA-loaded liposomes and lipoparticles.
Note: *Compared to 0 day, P < 0.001 (paired t-test) (n = 3).
Abbreviation: FITC-BSA, fluorescein isothiocyanate-conjugated bovine serum albumin.
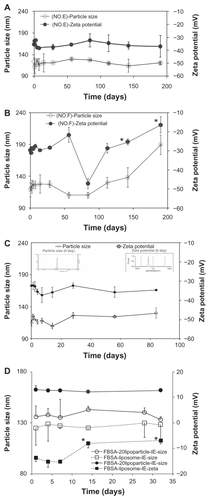
Table 2 The characteristics of FITC-BSA-loaded liposomes and lipoparticles
Figure 2 TEM image (left) and FE-SEM image (right) with 1% uranyl acetate negative staining. (A) FITC-BSA-loaded liposomes and (B) FITC-BSA-loaded lipoparticles. (C) FITC-BSA-loaded liposomes and (D) FITC-BSA-loaded lipoparticles. The scale bar is 100 nm. (E) Particle size distribution of FITC-BSA-loaded lipoparticles containing a protamine/FITC-BSA core.
Abbreviations: TEM, transmission electron microscope; FE-SEM, field-emission scanning electron microscope; FITC-BSA, fluorescein isothiocyanate-conjugated bovine serum albumin.
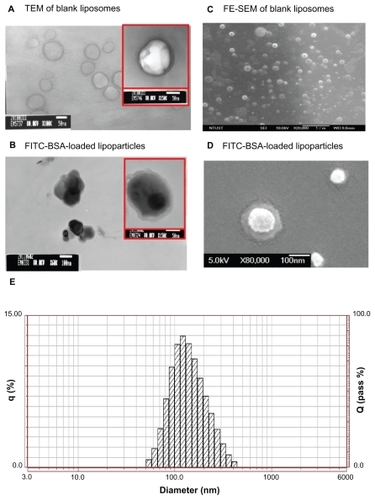
Figure 3 The remaining amount of FITC-BSA from the release profile of FITC-BSA-loaded liposomes and lipoparticles in PBS (pH 7.4) at 37°C. (A and C) Before lyophilization and (B and D) after lyophilization. FITC-BSA-loaded liposomes (⋄) and FITC–BSA-loaded lipoparticles containing a protamine/FITC-BSA 20/1 core (○) (n = 3).
Abbreviations: FITC-BSA, fluorescein isothiocyanate-conjugated bovine serum albumin; PBS, phosphate buffered saline.
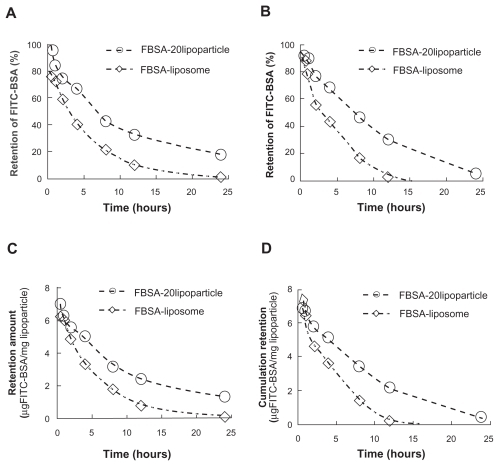
Table 3 Retention parameters for FITC-BSA-loaded particles obtained after fitting in vitrodrug release data (0.5–24 hours) to three different mathematical models for FITC-BSA retention kinetics
Figure 4 The 50% retention time (t50%) of FITC-BSA (before [white] and after [black] lyophilization) of the various formulations.
Notes: The results were calculated using the Higuchi equation. *P < 0.01.
Abbreviation: FITC-BSA, fluorescein isothiocyanate-conjugated bovine serum albumin.
![Figure 4 The 50% retention time (t50%) of FITC-BSA (before [white] and after [black] lyophilization) of the various formulations.Notes: The results were calculated using the Higuchi equation. *P < 0.01.Abbreviation: FITC-BSA, fluorescein isothiocyanate-conjugated bovine serum albumin.](/cms/asset/4a692e25-3fdf-4772-8328-a60e8b252439/dijn_a_25646_f0004_b.jpg)
Figure 5 Protein stability evaluation by SDS-PAGE (M, molecular weight markers; 1, BSA; 2, FITC-BSA; 3, FITC-BSA particle; 4, FITC-BSA liposome; 5, FITC-BSA lipoparticle-I; 6, FITC-BSA lipoparticle-IE; 7, Freeze-dried FITC-BSA lipoparticle-IE; 8, FITC-BSA lipoparticle-IE in 13.7 mM PBS for 4 hours; and 9, FITC-BSA lipoparticle-IE in 13.7 mM PBS for 8 hours).
Abbreviations: SDS-PAGE, sodium dodecyl sulfate polyacrylamide gel electrophoresis; FITC-BSA, fluorescein isothiocyanate-conjugated bovine serum albumin.
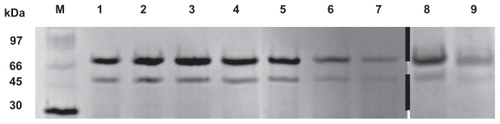
Figure 6 Cytotoxicity profile containing a protamine/FITC-BSA core (□) after a 72-hour incubation with Caco-2 cell, as determined by WST-1 assay. Percent viability of fibroblasts is expressed relative to control cells (n = 6).
Abbreviation: FITC-BSA, fluorescein isothiocyanate-conjugated bovine serum albumin.
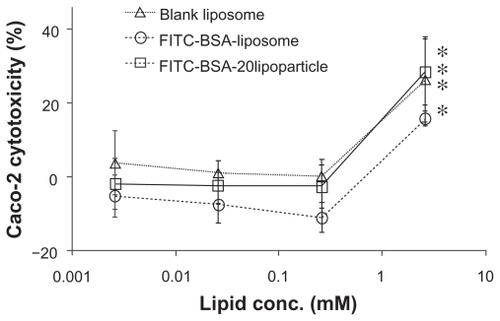
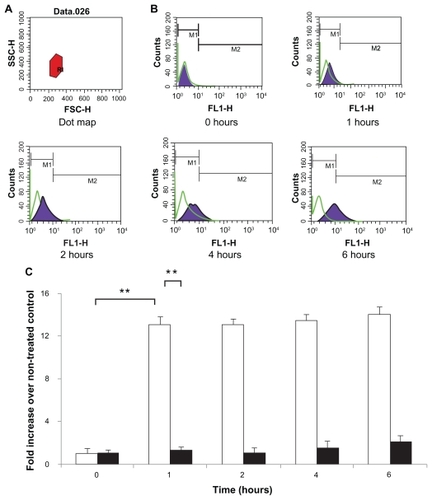
Figure 7 Caco-2 cell uptake profiles of FITC-BSA-loaded lipoparticles (blank) and liposomes (black). Data represents mean ± S D, n = 3. (A) Forward and side light scatter was used to gate the desired scattering events (normal cells) from dead cells and cell debris. (B) Uptake of FITC-BSA-loaded PEGylated liposomes and lipoparticles into Caco-2 cells. Cells were analyzed with 488 nm excitation and 522 nm band-pass filters in the emission path. (C) Fluorescence intensity of FITC-BSA-loaded liposome and lipoparticle preparations in normal cells expressed as the intensity ratio by dividing by the untreated control.
Notes: Data are expressed as mean ± SD, n = 3 (student’s t-test; ** P < 0.01).
Abbreviations: FITC-BSA, fluorescein isothiocyanate-conjugated bovine serum albumin; SD, standard deviation.