Figures & data
Figure 1 Comparison of pH variation of mesoporous bioactive glass (MBG)-polycarplolactone (PCL) and extracellular matrix (ECM)-coated scaffolds in distilled water (A) and X-ray photoelectron spectra before and after ECM coating (B).
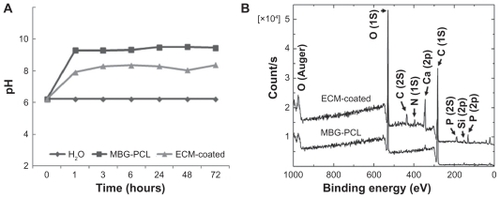
Figure 2 Field emission scanning electron microscopy images of mesoporous bioactive glass and polycarplolactone scaffolds before (A) and (B) and after (C) and (D) extracellular matrix component coating. (B) and (D) are the high magnification images of (A) and (B), respectively.
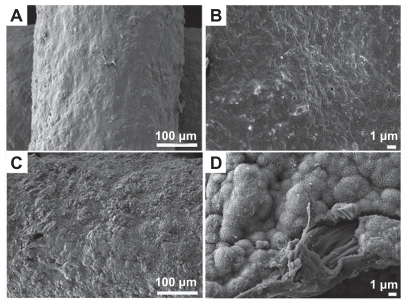
Figure 3 Comparison of the protein adsorption amount.
Note:***P < 0.001.
Abbreviation: ECM, extracellular matrix.
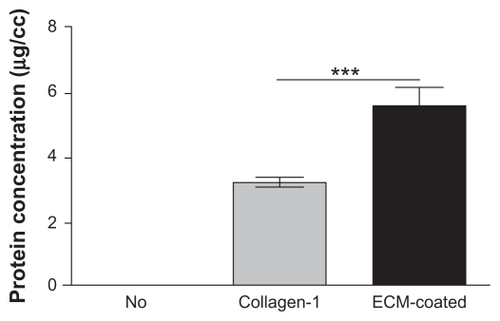
Figure 4 Wettability of polycarplolactone (PCL) (A) and mesoporous bioactive glass (MBG)-PCL scaffolds without (B) and with (C) extracellular matrix (ECM) component coating. (D–F) are field emission scanning electron microscopy images of initial cell attachment on PCL (D), MBG-PCL (E), and ECM-coated (F) scaffolds at 0.5 hours after seeding, and (G) and (H) are top view fluorescence microscope images of MBG-PCL (G) and ECM-coated (H) scaffolds after 6 hours of seeding.
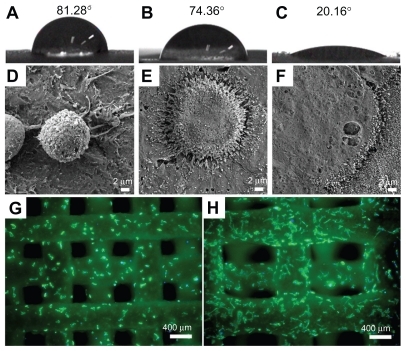
Figure 5 Initial MEC3T3-E1 cell attachment at 3 hours of culture (A), proliferation at 1, 3, 5, and 7 days of culture (B), and alkaline phosphate activity at 3, 7, and 14 days of culture (C) on three types of scaffolds expressed as a percentage of cell number.
Notes: Data are presented as the mean ± standard deviation (n = 5 samples per group). Differentiation from ECM-coated scaffolds (*P < 0.05, **P < 0.01, and ***P < 0.001).
Abbreviations: ECM, extracellular matrix; MBG, mesoporous bioactive glass; PCL, polycarplolactone.
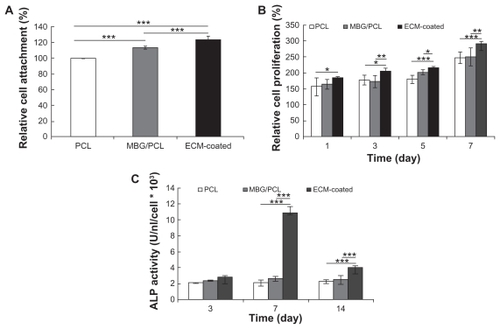
Figure 6 ALP activity of MT3T3-E1 cells on scaffolds with different surface conditions at 3, 7, and 14 days of culture.
Note: Data are presented as the mean ± standard deviation (n = 5 samples per group).
Abbreviations: ALP, alkaline phosphate; ECM, extracellular matrix; HA, hydroxy apatite; MBG, mesoporous bioactive glass; PCL, polycarplolactone.
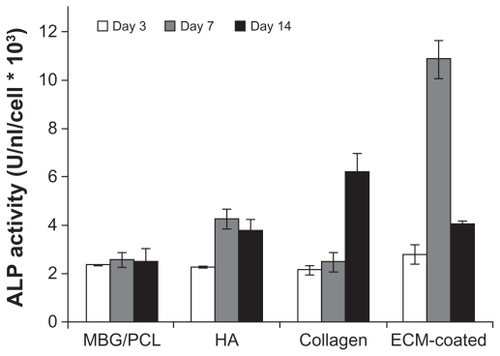
Figure 7 Quantitative real-time polymerase chain reaction analysis of RUNX2, collagen-I, ALP, OP, and OC mRNA expression in cells grown on each scaffold at 4 (A) and 7 (B) days of culture.
Note: Data are presented as the mean ± standard deviation (at least n = 3 samples per group). Differentiation from ECM-coated scaffolds (*P < 0.05, **P < 0.01, and ***P < 0.001).
Abbreviations: ALP, alkaline phosphate; ECM, extracellular matrix; MBG, mesoporous bioactive glass; OC, osteocalcine; OP, osteopontin; PCL, polycarplolactone.
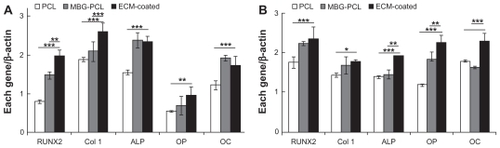
Figure 8 Field emission scanning electron microscopy images of extracellular matrixcoated scaffolds after 5 days of culture of MC3T3-E1 cell: first (A), second (B), third (C), and fourth layer (D).
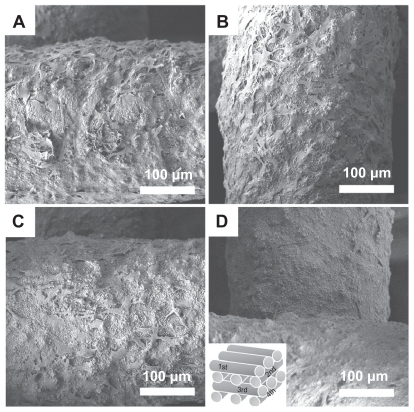
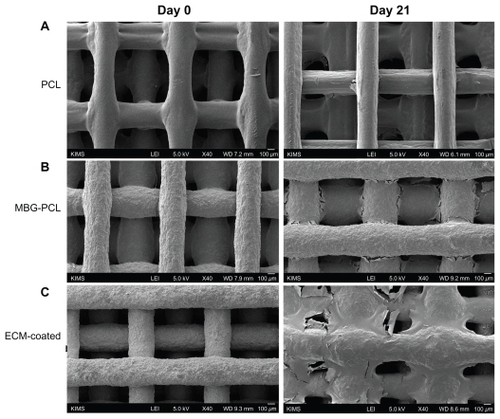
Figure 9 Field emission scanning electron microscopy images of cell growth before (left) and after 21 days (right) of culture of MC3T2-E1 cells on polycarplolactone (PCL), mesoporous bioactive glass (MBG)-PCL, and extracellular matrix (ECM)-coated scaffolds.
Scheme 1 Processing routes of extracellular matrix component-coated MBG/PCL scaffolds.
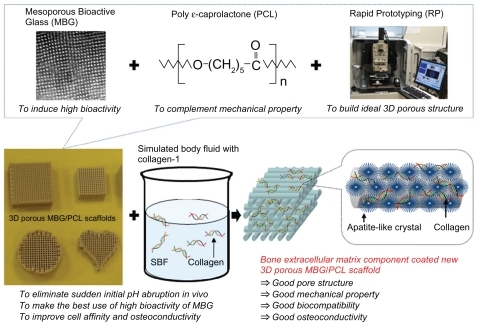
Figure S1 Field emission scanning electron microscopy images of mesoporous bioactive glass and polycarplolactone scaffold surface after immersing in simulated body fluid collagen solution for 4 hours (left) and 24 hours (right).
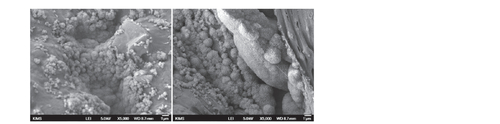
Figure S2 Electrodiagnostic studies corresponding to the surface of mesoporous bioactive glass and polycarplolactone scaffolds before (top) and after (bottom) extracellular matrix component coating.
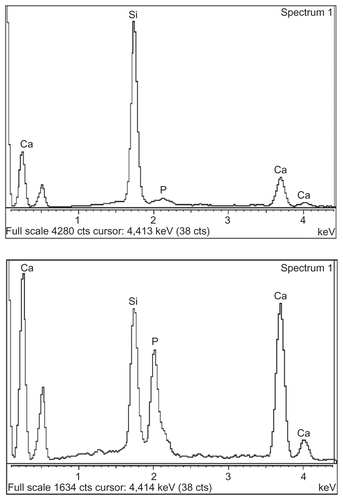
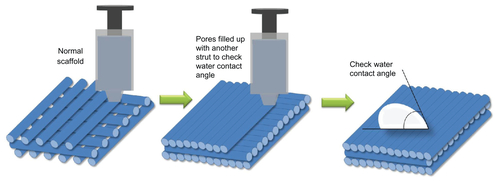
Figure S3 Sample preparation method for testing water contact angle.