Figures & data
Table 1 Physicochemical Characteristics of the Solutions Used for Particle Formation. In the Case of Viscosity, Electrical Conductivity and Density the Error was Negligible
Figure 1 Schematic illustration of (A) coaxial electrospray setup; (B) formulations of progesterone-loaded nanoparticles.
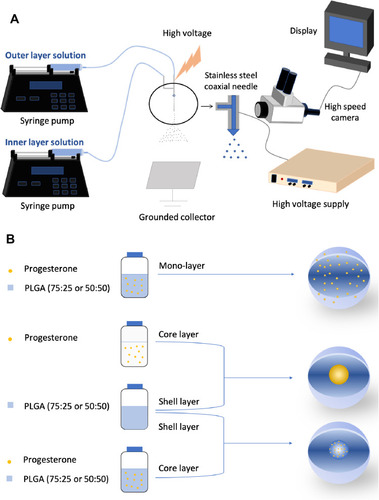
Table 2 Operating Conditions and Corresponding Particle Characterization
Figure 2 SEM images and corresponding diameter distribution of drug-loaded nanoparticles produced using coaxial needle electrospray (A) 2-layer1-50, (B) 2-layer2-50, (D) 2-layer1-75, (E) 2-layer2-75 and single needle electrospray (C) 1-layer-50 and (F) 1-layer-75, respectively. Scale bars: 10 µm.
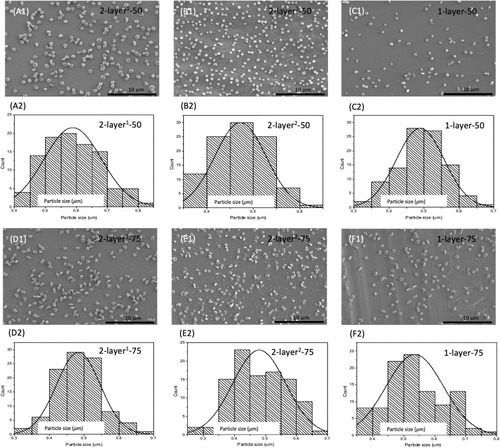
Figure 3 SEM images of gold labelled, drug-loaded nanoparticles. (A) monolayer nanoparticles and (B) double-layered nanoparticles. Scale bar: 1 µm.
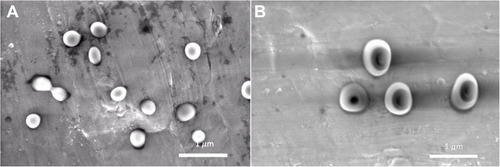
Figure 4 Confocal images of core shell nanoparticles, where the core (A) and shell layers (B) were labeled in the nanoparticles. Panel 1 shows the inner (A1) and outer layer (B1) in red and green, respectively. In the merged image (C1), the green outer layer overlapped with the red core color resulting in a yellow color. Therefore, panel 2 shows the inner (A2) and outer layer (B2) in white and green, respectively, to allow better distinction of the two layers in the merged image (C2). Scale bar: 1 µm.
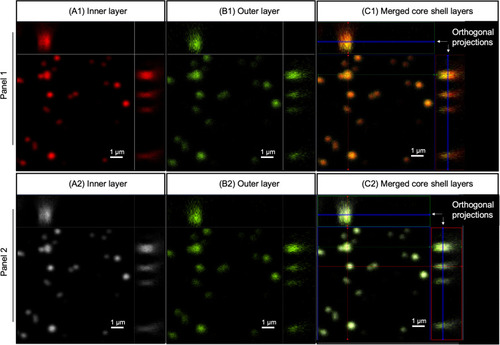
Figure 5 XRD patterns of PLGA (50:50), PLGA (75:25), progesterone, progesterone-loaded particle formulations 1-layer-50, 2-layer1-50, 2-layer2-50, 1-layer-75, 2-layer1-75 and 2-layer2-75.
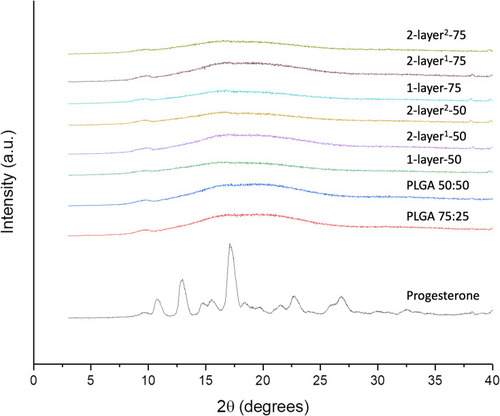
Figure 6 FTIR spectra of progesterone, PLGAs with different copolymer ratios (75:25 and 50:50) and electrosprayed progesterone-loaded particles.
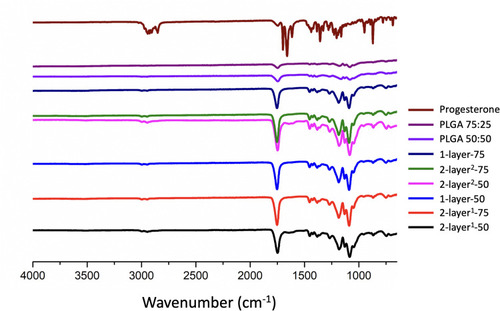
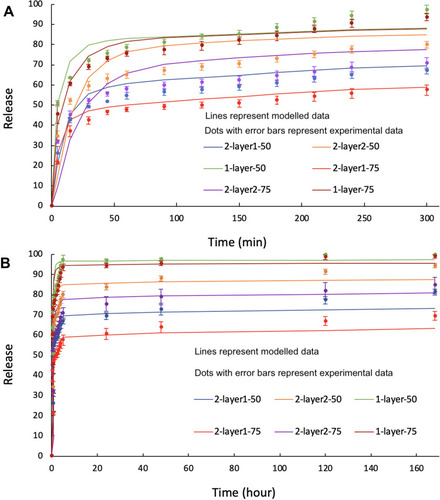
Figure 7 Release profile of progesterone from various formulations in comparison with progesterone dissolution on its own. (A) The release profile of progesterone from first five hours. (B) The release profile over seven days.
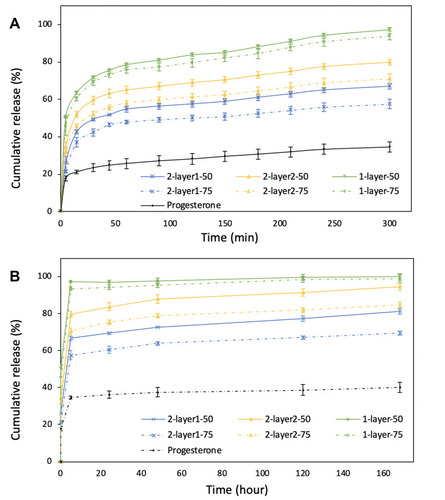
Table 3 Optimal Physical Parameters for the Fractional Release Model for the Various Particle Configurations
Figure 8 A comparison of the model (lines) and experimental (dots with error bars of the same color as the model lines): (A) early-stage, (B) Seven-day release from the 2-layer and 1-layer structures.