Figures & data
Scheme 1 Schematic illustration of molecular imaging diagnosis and subsequent enhanced treatment using the AFP@Fth plasmid.
Notes: Schematic illustration of molecular imaging diagnosis and subsequent enhanced treatment achieved in HepG2 cells via AFP@Fth plasmid. The plasmid specifically promoted Fth in HepG2 cells, and overexpressed Fth caused up-regulation of TfR expression, which increased intracellular iron accumulation and resulted in the lower signal intensity on MR T2WI. Tf-LPD was administrated 2 days after AFP@Fth transfection which targeted the overexpressed TfR and delivered doxorubicin into HepG2 cells.
Abbreviations: AFP@Fth, alpha-fetoprotein promoter Ferritin heavy chain plasmid; TfR, transferrin receptor; MR T2WI, magnetic resonance T2 weighted imaging; Tf-LPD, transferrin modified doxorubicin liposome.
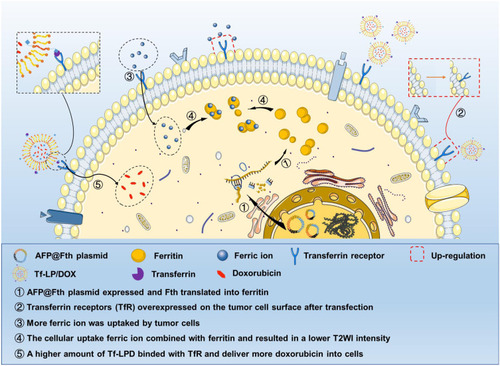
Figure 1 Characterization of different liposomes and drug release.
Notes: (A) 1H NMR of DSPE-PEG2000-Tf. (B) Size distribution and TEM images of LPs. (C) Size distribution and TEM images of Tf-LP. (D) Size distribution and TEM images of LPD. (E) Size distribution and TEM images of Tf-LPD. (F) Drug release of free DOX, LPD, and Tf-LPD.
Abbreviations: DSPE PEG2000-Tf, transferrin modified DSPE-PEG2000-Mal; TEM, transmission electron microscope; LP, liposome; Tf-LP, transferrin modified liposome; LPD, doxorubicin-loaded liposomes; Tf-LPD, transferrin modified doxorubicin liposome.
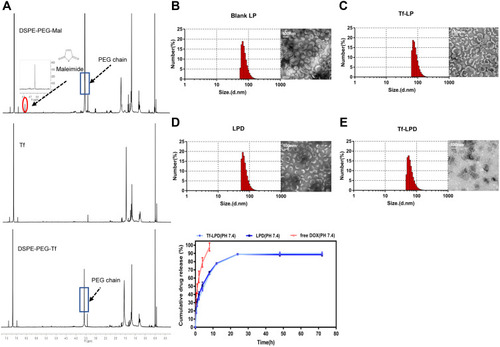
Table 1 Diameter and Zeta Potential of Different Liposomes
Figure 2 (A) Western blotting results for AFP expression in LO2 cells and HepG2 cells. (B) Western blotting results for Ferritin expression. (C) Quantitative values of AFP expression in LO2 cells and HepG2 cell (*p < 0.05, vs LO2 cell group, n = 3). (D) Quantitative values of Ferritin expression in HepG2 cells transfected for 24 h and 48 h, compared with untransfected HepG2 cells (***p<0.001, n = 3). (E) Immunofluorescence results of TfR upregulation in untransfected HepG2 cells and transfected HepG2 cells (24 h and 48 h). (F) Flow cytometry analyses for TfR surface expression. (G) MR images of untransfected HepG2 cells and transfected HepG2 cells (24 h and 48 h); with or without FAC (c = 0.5 mM) provided. (H) Quantitative T2*WI signal intensity analysis of HepG2 cells without FAC. (I) Quantitative T2WI signal intensity analysis of HepG2 cells with FAC (**p<0.01, vs HepG2 cell group and transfection for 24h group, n = 3).
Abbreviations: AFP, alpha-fetoprotein; TfR, transferrin; FAC, ferric ammonium citrate; T2*WI, T2* weighted imaging (ESWAN sequence).
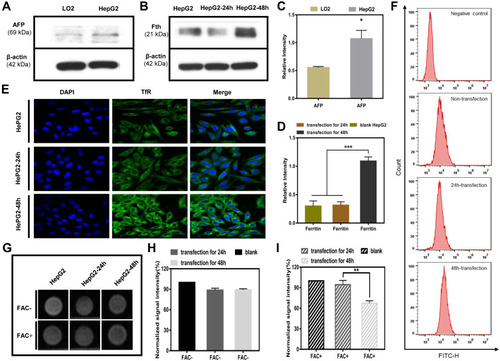
Figure 3 (A) Fluorescence images of cellular uptake (scale bar = 50 μm). (B) Flow cytometry analysis of cellular uptake in HepG2 treated with LPFITC. (C) Flow cytometry analysis of cellular uptake in HepG2 treated with Tf-LPFITC. (D) Semi-quantitative analysis of fluorescence signals, (*p < 0.05, **p < 0.01 and ***p < 0.001, n = 3). (E) Cell viability was with LPs and Tf-LP at various doses for 24 h. (F) Cell viability of HepG2 cells with LPD and free DOX. (G) Cell viability of HepG2 cells incubated with Tf-LPD and free DOX; (*p<0.05 and ***p<0.001, vs Tf-LPD group, n = 6).
Abbreviations: LP, liposome; Tf-LP, transferrin modified liposome; LPD, doxorubicin loaded liposomes; Tf-LPD, transferrin modified doxorubicin liposome; DOX, doxorubicin.
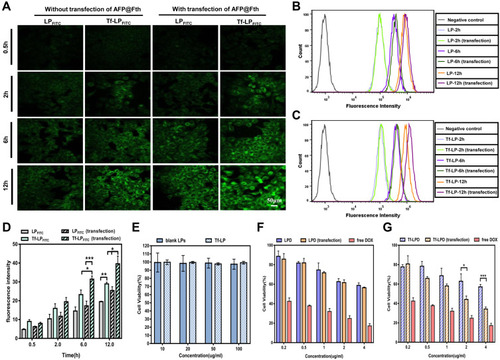
Figure 4 (A) Western blotting results of Ferritin expression in liver and tumor tissues. (B) The quantitative analysis of protein bands, (*p < 0.05 and **p < 0.01, vs untransfected group, n = 3). (C) Biodistribution of LP/ICG and Tf-LP/ICG. (D) Semi-quantitative analysis of fluorescence intensity in tumors (**p < 0.01 and ***p < 0.001, vs untransfected group, n = 3).
Abbreviations: LP/ICG, ICG loaded liposome; Tf-LP/ICG, transferrin modified ICG loaded liposome; ICG, indocyanine green.
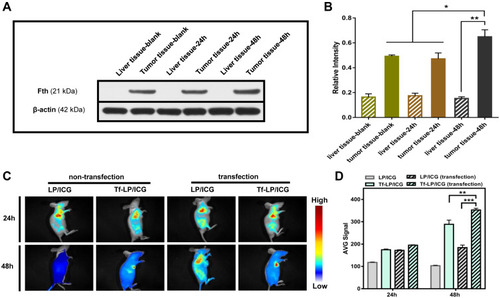
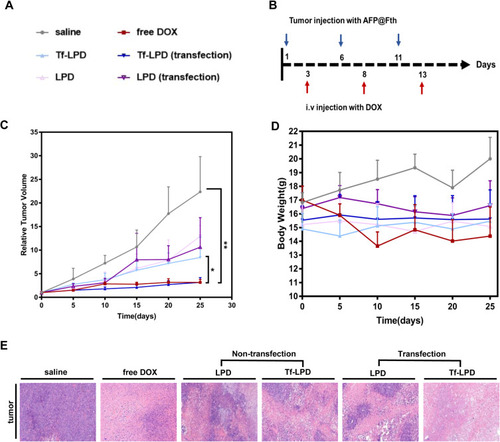
Figure 5 (A) Groups during treatment. (B) Plasmid injection and drug administration schedule. (C) Relative tumor volume growth curves after injection with various drugs for 25 days, *p<0.05 and **p<0.01, vs Tf-LPD (transfected group), n = 5. (D) Bodyweight change curves. (E) Representative H&E sections of tumor tissues of mice after treatment with saline, free DOX, LPD, and Tf-LPD.
Abbreviations: Tf-LPD, transferrin modified doxorubicin liposome; H&E, hematoxylin-eosin staining.