Figures & data
Figure 1 Schematic of PAA-MoS2 NPs as a carrier capable of achieving the delivery of ATE and controlled drug release for transdermal administration.
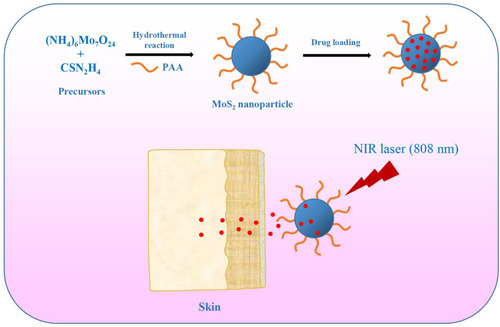
Figure 2 ATR-FTIR spectra of PAA-MoS2 NPs.
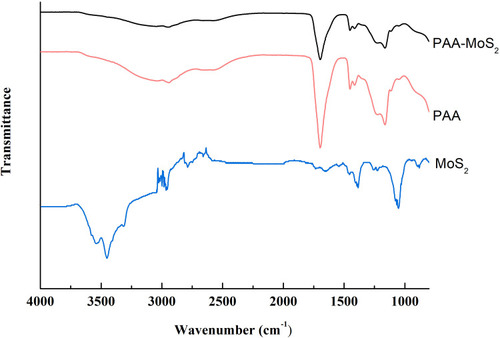
Figure 3 XRD pattern for the as-prepared PAA (A) and PAA-MoS2 NPs (B).
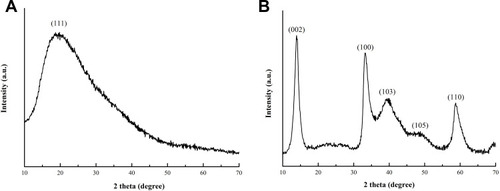
Figure 4 SEM (A and B) and TEM (C and D) of the PAA-MoS2 NPs.
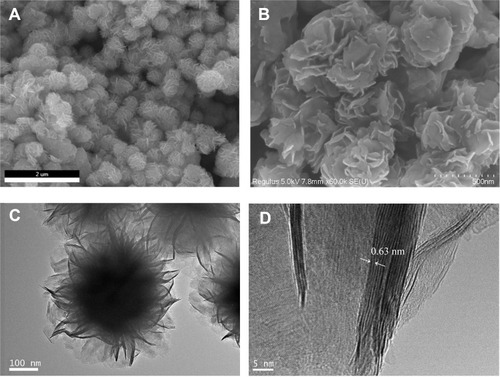
Figure 5 Elemental mapping images of PAA-MoS2 composites: (A) Mo element, (B) S element, (C) C element and (D) O element.
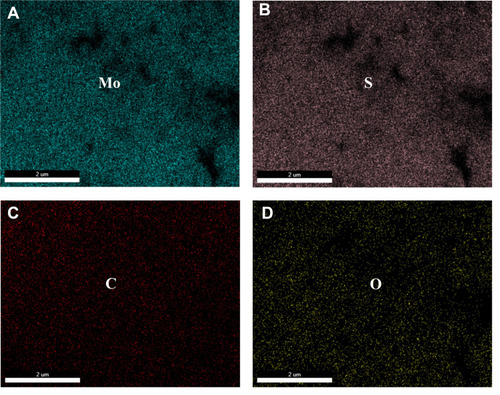
Figure 6 Heating curves of (A) various PAA-MoS2 NPs concentrations under a laser power of 0.5 W/cm−2, (B) PAA-MoS2 NPs of 0.5 mg/mL under varying laser powers, and (C) PAA-MoS2 NPs over three on-off cycles (0.5 W/cm2, 0.5 mg/mL).
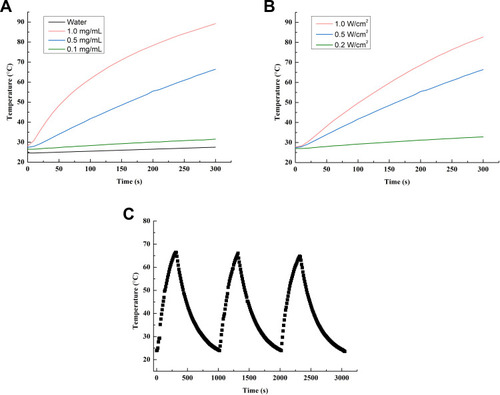
Figure 7 Drug loading efficiency achieved at various mass ratios of ATE to PAA-MoS2 NPs.
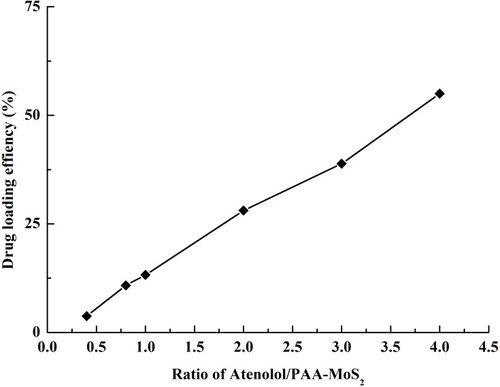
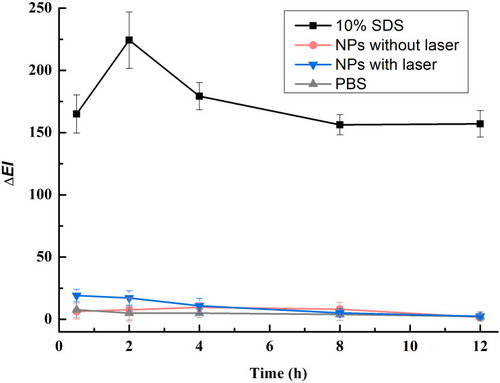
Figure 8 (A) Drug release with and without laser stimulation, (B) skin penetration of ATE released from PAA-MoS2 NPs with and without laser stimulation.
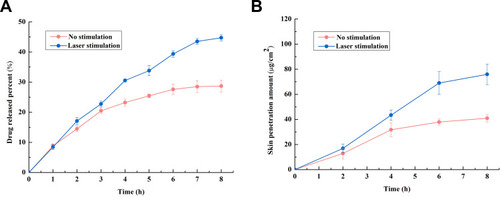
Figure 9 Skin penetration of ATE released from PAA-MoS2 NPs with and without NIR stimulation.