Figures & data
Figure 1 (A) XRD pattern of Co metal nanoparticles used in the study, (B) high-resolution overview of cubic Co metal nanoparticles of 5nm diameter, inset is a high-resolution TEM image of one cobalt nanoparticle (C) low magnification TEM overview of cubic Co metal nanoparticles agglomerated, (D) size distribution histogram.
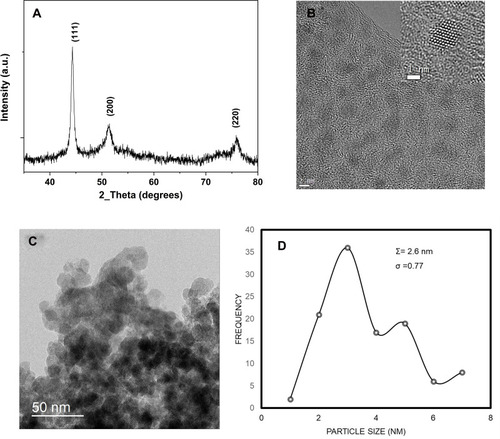
Figure 2 M-H hysteresis loop measured at 300K for Co nanoparticles, inset shows the details of the measurement around the origin.
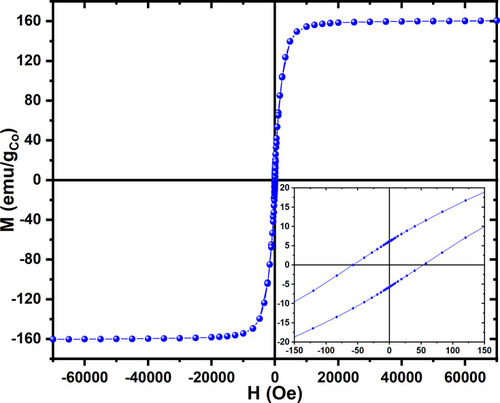
Figure 3 Optical images of agglomerated Co MNPs studied by Raman spectroscopy with a laser power of (A) 5mW and (B) 20mW, (C) comparison of the Raman pattern obtained from Co MNPs powder with 532nm laser excitation under low power 5mW indicated by blue spectrum (A) to higher laser power 20mW indicated by red spectrum (B).
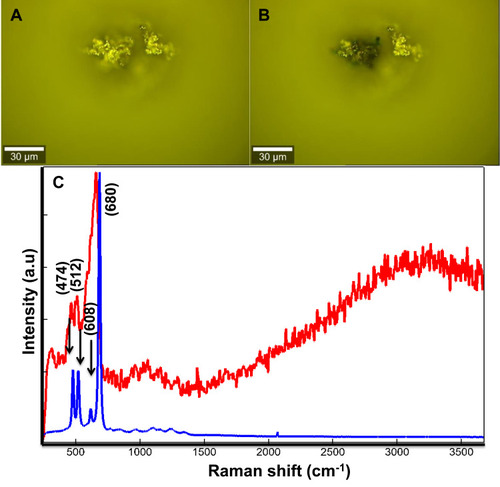
Figure 4 Raman patterns obtained from Co MNPs outside the MCF7cells (blue spectrum) and inside MCF7cells (red spectrum) with 532nm laser excitation under 5mW.
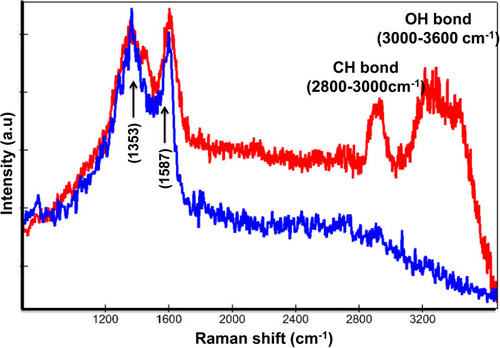
Figure 5 MCF-7 cells incubated with Co nanoparticles, (A) integrated Raman intensities in the 2800–3000cm−1 region of cells, (B) Raman reconstruction of image A using KMCA to detect Co nanoparticles (green pixels indicated by arrows), (C) Raman spectrum of Co MNPs inside MCF7 cells (indicated by the red arrow), and (D) spectrum outside of the cells (blue arrows).
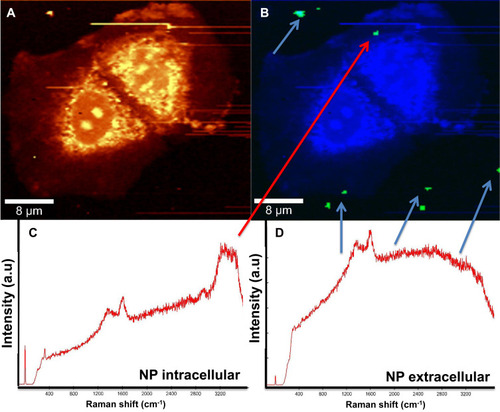
Figure 6 Raman reconstructed images showing Co MNPs inside cells (indicated by red arrows) and outside cells (indicated by blue arrows) when incubated for 1 hour with breast cancer cells MCF7 (A and B), colorectal cancer cells HCT116 (C and D) and with dental pulp mesenchymal stem cells DPSC (E–H).
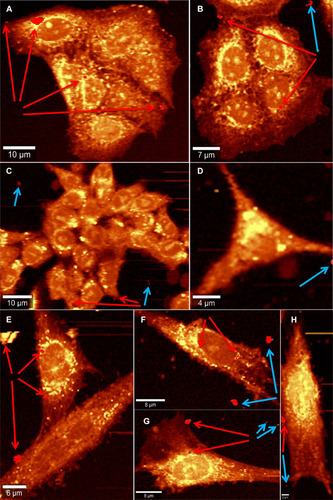
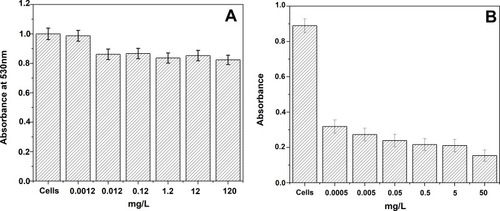
Figure 7 Toxicity test of cobalt metal nanoparticles (A) on HEK 293 cells, (B) on PPC-1 cells.