Figures & data
Figure 1 Infrared spectra of (A) morin; (B) phospholipids; (C) morin-phospholipid complex; and (D) physical mixture of morin and phospholipids.
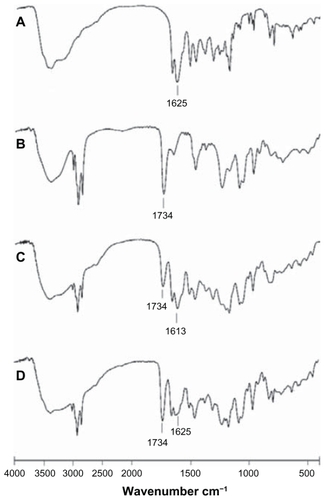
Figure 2 X-ray diffraction pattern of (A) morin; (B) phospholipids; (C) morinphospholipid complex; and (D) physical mixture of morin and phospholipids.
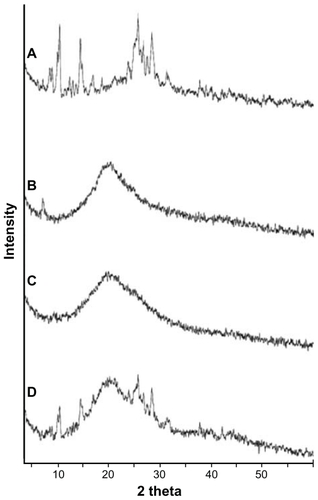
Table 1 Solubility of morin, MPC, and the physical mixture in water and n-octanol at room temperature
Table 2 Solubility of morin and MPC in different oils at room temperature
Table 3 Factors and levels of L9 (33) orthogonal test
Table 4 Droplet size and polydispersity index of SNEDDS formulations after dilution with distilled water at a ratio of 1:100
Figure 3 Ternary phase diagram of the SNEDDS formulation composed of the following: oil – Labrafil M 1944 CS; surfactant – Cremophor RH 40; and cosurfactant – Transcutol P, with a drug loading of 10%.
Notes: The red outline represents the area explored for locating nanoemulsion region. The blue area represents nanoemulsion region.
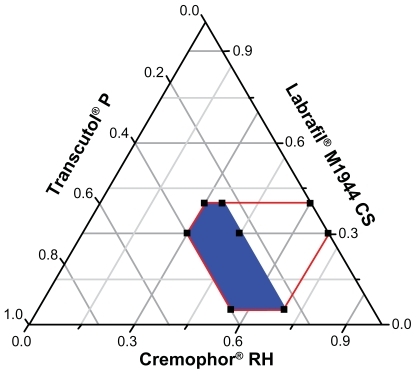
Figure 4 Transmission electron microscope image of MPC-loaded SNEDDS formulation.
Note: Scale bar = 200 nm.
Abbreviations: MPC, morin-phospholipid complex; MPC-SNEDDS, morinphospholipid complex self-nanoemulsifying drug delivery system.
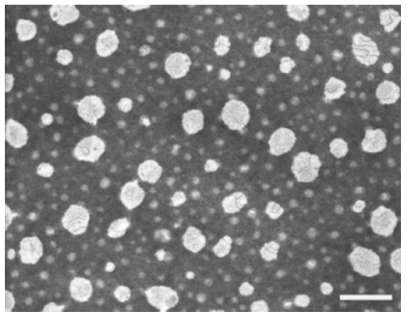
Table 5 Bioavailability and pharmacokinetic parameters (mean ± standard deviation) of morin in Wistar rats after oral administration of morin, MPC, and MPC-SNEDDS at a dose of 200 mg/kg (n = 5)
Figure 5 HPLC chromatographs of morin.
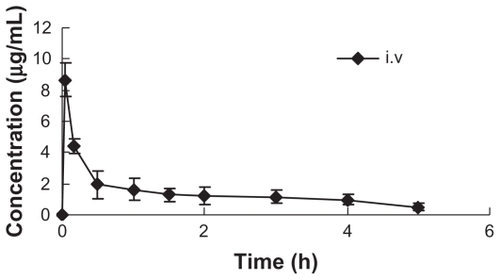
Figure 6 Plasma concentration-time curve after intravenous administration of morin in Wistar rats (n = 5) at a dose of 1 mg/kg.
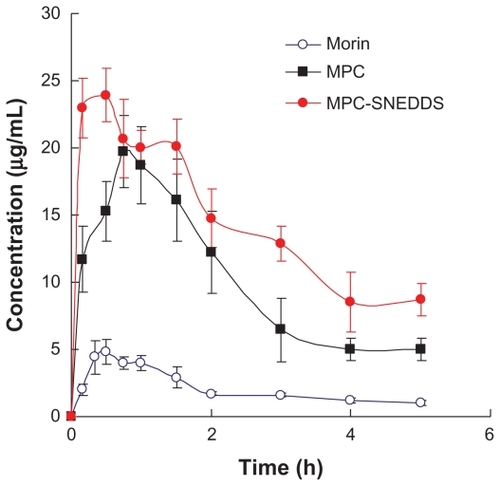
Figure 7 Mean plasma concentration-time profiles of morin in Wistar rats (n = 5) after oral administration of morin, MPC, and MPC-SNEDDS formulation at a dose of 200 mg/kg.
Abbreviations: MPC, morin-phospholipid complex; MPC-SNEDDS, morin-phospholipid complex self-nanoemulsifying drug delivery system.
Notes: (A) Blank plasma; (B) plasma containing morin; internal standard: benzoic acid.
Abbreviation: HPLC, high performance liquid chromatography.
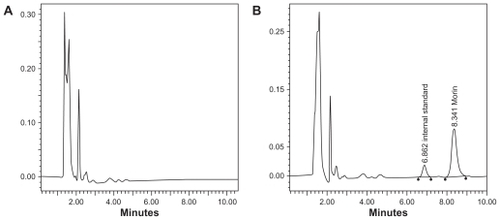
Figure 6 Plasma concentration-time curve after intravenous administration of morin in Wistar rats (n = 5) at a dose of 1 mg/kg.
Figure 7 Mean plasma concentration-time profiles of morin in Wistar rats (n = 5) after oral administration of morin, MPC, and MPC-SNEDDS formulation at a dose of 200 mg/kg.
Abbreviations: MPC, morin-phospholipid complex; MPC-SNEDDS, morin-phospholipid complex self-nanoemulsifying drug delivery system.