Figures & data
Table 1 List of random primersTable Footnotea
Figure 1 DPV diagram of 20 μmol/L guanine and 20 μmol/L deoxyguanine triphosphate on multiwalled nanotube-modified glassy carbon electrode.
Abbreviations: dGTP, deoxyguanine triphosphate; DPV, differential pulse voltammetric.
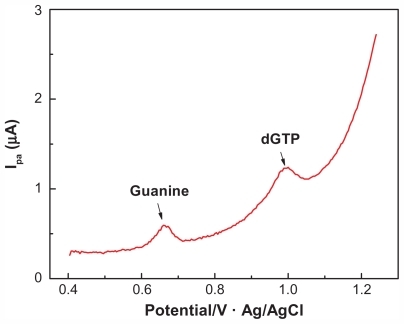
Figure 2 DPV diagram (A) of deoxyguanine triphosphate of different concentrations on multiwalled nanotube-modified glassy carbon electrode and the working curve (B) reflecting the relationship between oxidation peak current and concentration change.
Abbreviations: dGTP, deoxyguanine triphosphate; DPV, differential pulse voltammetric.
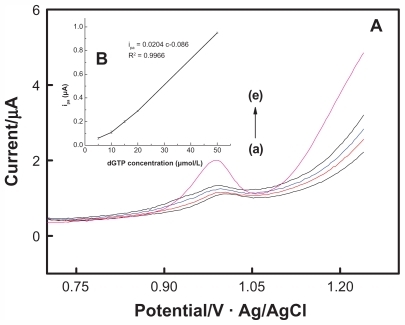
Figure 3 Diagrams of differential oxidation current between pancreatic cancer patient and normal control (A) and the gel electrophoresis of polymerase chain reaction product (B) on multiwalled nanotube-modified glassy carbon electrode.
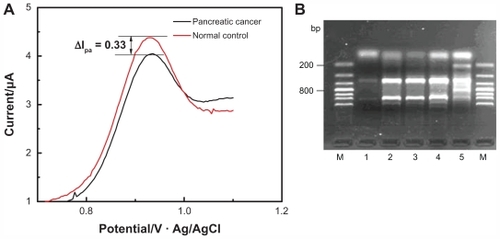
Figure 4 Result of clone sequencing of the differential polymerase chain reaction product.
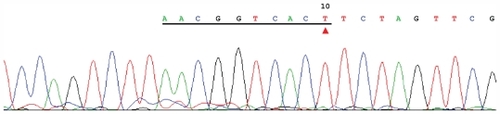
Figure 5 DPV curve generated from different pancreatic cancer samples amplified via arbitrarily primed polymerase chain reaction and detected using a multiwalled nanotube-modified glassy carbon electrode.
Abbreviation: DPV, differential pulse voltammetric
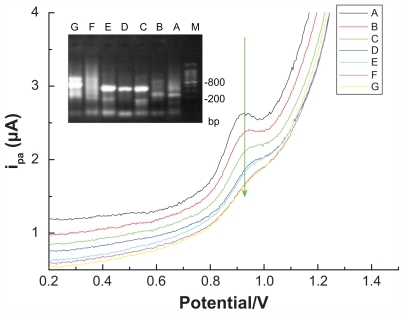
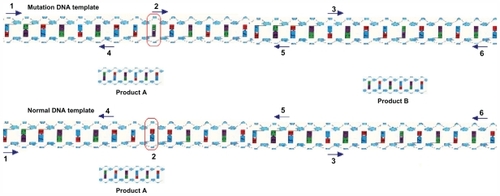
Figure 6 Schematic diagram of the screening of genetic alterations using random primers.