Figures & data
Figure 1 SDS-PAGE and Western blot profile of culture supernatant SAgs of Listeria monocytogenes. (A) SDS-PAGE profile of proteins present in L. monocytogenes culture supernatant. Lane i corresponds to protein profile and lane ii shows the molecular weight markers. (B) Western blot profile of the same proteins isolated from culture supernatant, probed with mouse antisera.
Abbreviations: SAgs, secretory protein antigens; SDS-PAGE, sodium dodecyl sulfate polyacrylamide gel electrophoresis.
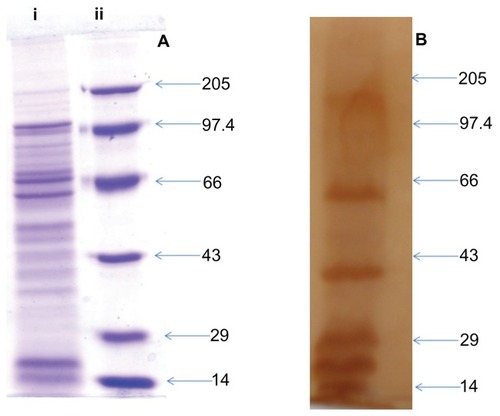
Figure 2 Characterization of archaeosomes and their interaction with macrophages. (A) Size of in-house prepared archaeosomes as determined by nanophox size analyzer (B) SEM image of archaeosomes and (C) interaction of archaeosomes with J774A.1 macrophages as visualized by confocal microscopy. The left panel shows a fluorescence microscopic image of archaeosomes entrapped in macrophages, a bright field image of the same is shown in the middle panel and the right panel represents superpositioning of left and middle panels.
Abbreviation: SEM, scanning electron microscope.
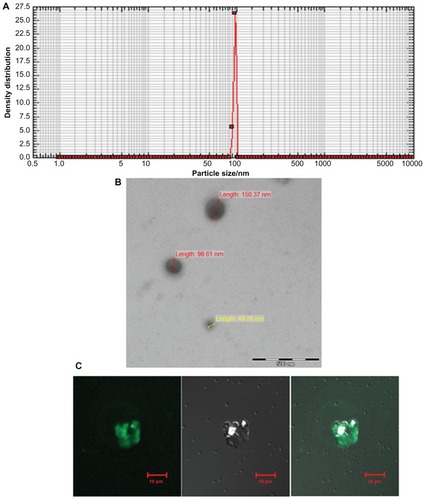
Figure 3 Archaeosome-entrapped SAgs induce Th1 biased response in immunized mice. By determining cytokine response in splenocyte culture supernatant of various immunized groups, Th1/Th2 response was ascertained at different time points, prior and post-challenge with Listeria monocytogenes infection; (A) IFN-γ, (B) IL-12, (C) IL-4. (D) Ratio of IgG2a to IgG1 was analyzed in sera of various immunized groups except controls (PBS and sham archaeosomes) to further confirm TH1/Th2 polarization upon immunization with archaeosome-entrapped SAgs.
Notes: The data represent the mean of three determinants ± SD and are representative of three different experiments (ie, the experiment was done in triplicate) with similar observations. Statistically groups were compared with each other using ANOVA with the Holm–Sidak test (all pairwise multiple comparison procedures) with P < 0.05, P < 0.01, P < 0.001, post-booster, and post-challenge.
Abbreviations: PBS, phosphate buffer saline; SD standard deviation; ANOVA, analysis of variance; SAgs, secretory protein antigens.
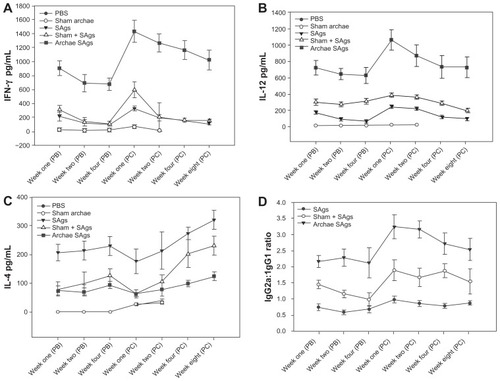
Figure 4 Proliferative response of lymphocytes belonging to various immunized groups upon stimulation with SAgs. To determine the effect of the amount of SAgs on the proliferation of lymphocytes, lymphocytes isolated from the spleens of immunized BALB/c mice of various vaccinated groups including controls, were cultured in flat-bottomed 96-well plates. The cells were co-cultured in the presence of increasing doses (1–20 μg) of corresponding formulations of SAgs as well as controls. After 72 hours [3H]-thymidine was added and its incorporation into multiplying cells was measured after 16 hours of incubation, using liquid scintillation spectroscopy. The CPM values of stimulated culture were used to represent Ag-specific stimulation. (A) Dose-dependent proliferative response of lymphocytes at 1-week post-booster and post-challenge (data not shown) upon stimulation with various SAgs formulations. (B) Lymphocyte proliferation in terms of CPM values in various immunized groups at PB and 2 weeks PC time points.
Notes: Data represent the mean of three determinants ± SD. The figures are representative of three independent experiments. The groups were compared using ANOVA. Holm–Sidak test (all pairwise multiple comparison procedures) with *** P < 0.001.
Abbreviations: CPM, counting per minute; PB, post-booster; PC, post-challenge; PBS, phosphate buffer saline; ANOVA, analysis of variance; SD, standard deviation; SAgs, secretory protein antigens.
![Figure 4 Proliferative response of lymphocytes belonging to various immunized groups upon stimulation with SAgs. To determine the effect of the amount of SAgs on the proliferation of lymphocytes, lymphocytes isolated from the spleens of immunized BALB/c mice of various vaccinated groups including controls, were cultured in flat-bottomed 96-well plates. The cells were co-cultured in the presence of increasing doses (1–20 μg) of corresponding formulations of SAgs as well as controls. After 72 hours [3H]-thymidine was added and its incorporation into multiplying cells was measured after 16 hours of incubation, using liquid scintillation spectroscopy. The CPM values of stimulated culture were used to represent Ag-specific stimulation. (A) Dose-dependent proliferative response of lymphocytes at 1-week post-booster and post-challenge (data not shown) upon stimulation with various SAgs formulations. (B) Lymphocyte proliferation in terms of CPM values in various immunized groups at PB and 2 weeks PC time points.Notes: Data represent the mean of three determinants ± SD. The figures are representative of three independent experiments. The groups were compared using ANOVA. Holm–Sidak test (all pairwise multiple comparison procedures) with *** P < 0.001.Abbreviations: CPM, counting per minute; PB, post-booster; PC, post-challenge; PBS, phosphate buffer saline; ANOVA, analysis of variance; SD, standard deviation; SAgs, secretory protein antigens.](/cms/asset/74cd2eca-cc75-4d0a-84e0-21364d552008/dijn_a_25875_f0004_c.jpg)
Figure 5 Archaeosome-entrapped SAgs generate strong DTH response. To ascertain the induction ability of archaeosome-entrapped SAgs to evoke cell-mediated immune response in the immunized mice, mean DTH response was evaluated by measuring footpad swelling in the groups immunized with PBS, sham archaeosomes, free SAgs, sham archaeosomes mixed with free SAgs, and archaeosomes-entrapped SAgs (Archae-SAgs) after various time intervals; DTH response was found to be substantially high in the group immunized with archaeosome-encapsulated SAgs.
Notes: Data are representative of three independent experiments ± SD values. ***P values < 0.001 were considered statistically significant. Archaeosome-entrapped SAgs vs free SAgs ***P < 0.001.
Abbreviations: PBS, phosphate buffer saline; SD, standard deviation; DTH, delayed type hypersensitivity; SAgs, secretory protein antigens.
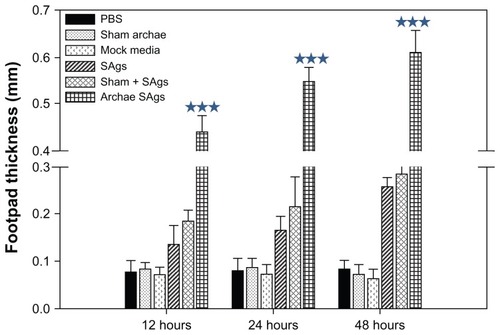
Figure 6 Archaeosome-entrapped SAgs upregulate the expression of costimulatory molecules on antigen-presenting cells. The expression of costimulatory molecules, CD80 (B7-1) and CD86 (B7-2), on macrophages was determined by staining target cells with specific antibodies and subsequent analysis by flow cytometry at 2 weeks post-challenge. The dot plot graphs for (A) CD80 and (B) CD86 represent various immunized groups: (i) Sham archaeosomes as control; (ii) free culture supernatant SAgs; (iii) Sham + SAgs as a physical mixture; (iv) Archaeosome-entrapped culture supernatant SAgs and (v) and isotype control. The bar graphs corresponding to (C) CD80 and (D) CD86 depict the mean percentage of three determinants (±SD).
Notes: Data were analyzed with Student’s t-test and are representative of three independent experiments. Archaeosome-entrapped SAgs vs free SAgs ***P < 0.001 (CD80), ***P < 0.001 (CD86); physical mixture vs free SAgs P = NS (CD80), **P < 0.01. The CD80/86 population histogram was same as that of sham archaeosome and is not shown.
Abbreviations: PBS, phosphate buffer saline; SD, standard deviation; SAgs, secretory protein antigens; NS, not significant.
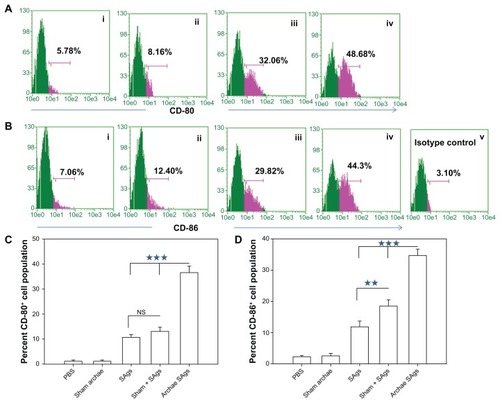
Figure 7 Augmentation of CD8+/CD4+ T cell effector memory response upon immunization with archaeosome-entrapped SAgs. The CD4+ and CD8+ T cells were harvested and their purity was depicted as described in the ‘Materials and methods’ section. The (A) CD4+CD44highCD62Llow/high and (B) CD8+CD44highCD62Llow/high phenotypes were analyzed using flow cytometry at 2 weeks post-challenge, representing various immunized groups: (i) Sham archaeosomes as control; (ii) free culture supernatant SAgs; (iii) Sham + SAgs as aphysical mixture; (iv) archaeosome-entrapped culture supernatant SAgs; and (v) isotype control. The bar graph depicts the population of (C) CD4+CD44highCD62Lhigh/low and (D) CD8+CD44highCD62Lhigh/low and is representative of three independent experiments and presented as mean ± SD.
Notes: Archaeosome-entrapped SAgs vs free SAgs ***P < 0.001 (CD4+CD44highCD62Lhigh; CD4+CD44highCD62Llow), P < 0.001 (CD8+CD44highCD62Lhigh; CD8+CD44highCD62Llow); physical mixture vs free SAgs *P < 0.05 CD4+CD44highCD62Lhigh; P = NS CD4+CD44highCD62Llow, P < 0.05 CD8+CD44highCD62Lhigh; P = NS CD8+CD44highCD62Llow.
Abbreviations: SD, standard deviation; SAgs, secretory protein antigens; NS, not significant.
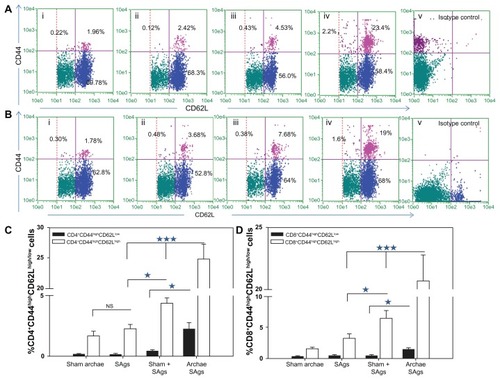
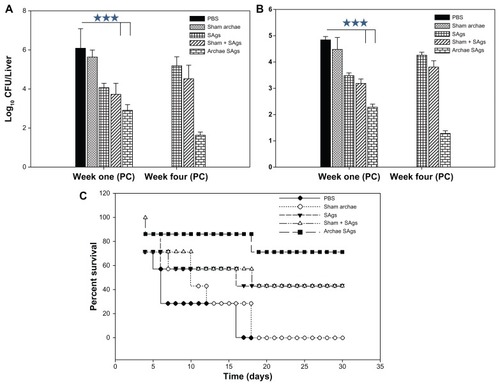
Figure 8 Archaeosome-encapsulated SAgs exhibit better protective effect against L. monocytogenes challenge in BALB/c mice. The bacterial load in the (A) liver and (B) spleen of vaccinated mice belonging to various groups was enumerated by plating their liver and spleen homogenates and counting the numbers of CFUs at 1 and 4 weeks post-challenge. The animals from various vaccinated groups were challenged with 1 × 10⁷ CFU, thereafter they were monitored for a period of 1 month. (C) Data are represented here in terms of percentage survival.
Notes: The data are expressed as means of three determinants ± SD and are representative of three independent experiments. Statistical analysis was performed by analysis of variance with the Holm–Sidak method (all pairwise multiple comparison procedures) to compare the significance between the two groups. ***P < 0.001 value was considered significant.
Abbreviations: CFU, colony-forming unit; SAgs, secretory protein antigens; PBS, phosphate buffer saline; SD standard deviation.