Figures & data
Figure 1 The histogram of size distribution measured by a Malvern Zetasizer.
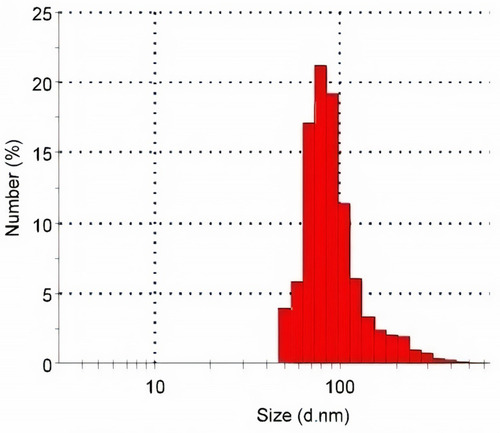
Table 1 Primer Sequences of Genes Analyzed in Real-Time PCR
Table 2 The Effect of Selenium Nanoparticles (SeNPs) on Behavioral Alterations Induced Following Pentylenetetrazole (PTZ) Injection in Mice
Figure 2 Effect of selenium nanoparticles (SeNPs) on pro-oxidants level [malondialdehyde (MDA) and nitric oxide (NO)], heat shock protein 70 (Hsp70), glutathione (GSH) level in the hippocampal tissue following pentylenetetrazole (PTZ) injection. Results are figured as mean ± SD (n = 10); significant change was recorded following analysis with Duncan’s test as a post hoc test (P < 0.05). #Represents a significant change against the control mice; $Represents a significant change against the PTZ-injected mice.
![Figure 2 Effect of selenium nanoparticles (SeNPs) on pro-oxidants level [malondialdehyde (MDA) and nitric oxide (NO)], heat shock protein 70 (Hsp70), glutathione (GSH) level in the hippocampal tissue following pentylenetetrazole (PTZ) injection. Results are figured as mean ± SD (n = 10); significant change was recorded following analysis with Duncan’s test as a post hoc test (P < 0.05). #Represents a significant change against the control mice; $Represents a significant change against the PTZ-injected mice.](/cms/asset/9728850a-5264-42b2-8612-e7fee9c68c8b/dijn_a_12194744_f0002_c.jpg)
Figure 3 Effect of selenium nanoparticles (SeNPs) on mRNA and activity of antioxidant enzymes [glutathione peroxidase (GPx, Gpx1), glutathione reductase (GR, Gsr), superoxide dismutase (SOD, Sod2) and catalase (CAT, Cat)] in the hippocampal tissue following pentylenetetrazole (PTZ) injection. Biochemical results are figured as mean ± SD (n = 10); significant change was recorded following analysis with Duncan’s test as a post hoc test (P < 0.05). #Represents a significant change against the control mice; $Represents a significant change against the PTZ-injected mice. qRT-PCR results are presented as mean ± SD of triplicate assays.
![Figure 3 Effect of selenium nanoparticles (SeNPs) on mRNA and activity of antioxidant enzymes [glutathione peroxidase (GPx, Gpx1), glutathione reductase (GR, Gsr), superoxide dismutase (SOD, Sod2) and catalase (CAT, Cat)] in the hippocampal tissue following pentylenetetrazole (PTZ) injection. Biochemical results are figured as mean ± SD (n = 10); significant change was recorded following analysis with Duncan’s test as a post hoc test (P < 0.05). #Represents a significant change against the control mice; $Represents a significant change against the PTZ-injected mice. qRT-PCR results are presented as mean ± SD of triplicate assays.](/cms/asset/852ff83c-2b08-43fc-ab2e-dd40c88935ba/dijn_a_12194744_f0003_c.jpg)
Figure 4 Effect of selenium nanoparticles (SeNPs) on the protein expression of nuclear factor erythroid 2-related factor 2 (Nrf2) and heme oxygenase-1 (HO-1) in the hippocampal tissue following pentylenetetrazole (PTZ) injection. #Represents a significant change against the control mice; $Represents a significant change against the PTZ-injected mice.
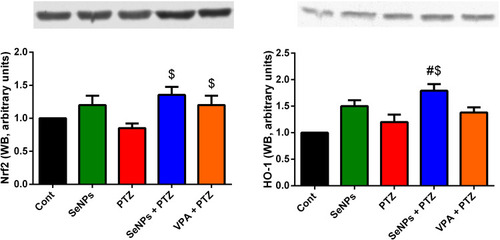
Figure 5 Effect of selenium nanoparticles (SeNPs) on inflammatory markers TNF-α and IL-1β in the hippocampal tissue following pentylenetetrazole (PTZ) injection. Results are figured as mean ± SD (n = 10); significant change was recorded following analysis with Duncan’s test as a post hoc test (P < 0.05). #Represents a significant change against the control mice; $Represents a significant change against the PTZ-injected mice.
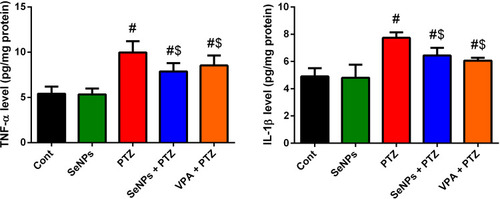
Figure 6 Effect of selenium nanoparticles (SeNPs) on apoptotic markers Bax, caspase-3 and Bcl2 in the hippocampal tissue following pentylenetetrazole (PTZ) injection. Results are figured as mean ± SD (n = 10); significant change was recorded following analysis with Duncan’s test as a post hoc test (P < 0.05). #Represents a significant change against the control mice; $Represents a significant change against the PTZ-injected mice.
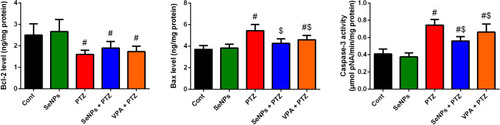
Figure 7 Effect of selenium nanoparticles (SeNPs) on dopamine (DA), norepinephrine (NE) and serotonin (5-HT) in the hippocampal tissue following pentylenetetrazole (PTZ) injection. Results are figured as mean ± SD (n = 10); significant change was recorded following analysis with Duncan’s test as a post hoc test (P < 0.05). #Represents a significant change against the control mice; $Represents a significant change against the PTZ-injected mice.
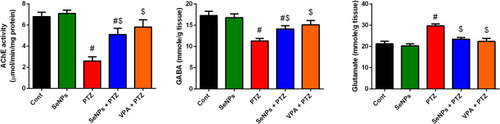
Figure 8 Effect of selenium nanoparticles (SeNPs) on acetylcholinesterase activity (AChE), GABA and glutamate levels in the hippocampal tissue following pentylenetetrazole (PTZ) injection. Results are figured as mean ± SD (n = 10); significant change was recorded following analysis with Duncan’s test as a post hoc test (P < 0.05). #Represents a significant change against the control mice; $Represents a significant change against the PTZ-injected mice.
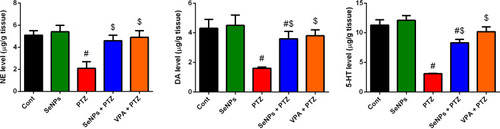
Figure 9 Effect of selenium nanoparticles (SeNPs) on hippocampal histological deformations following pentylenetetrazole (PTZ) injection. Scale bar = 100 μm. (A) Control group, (B) SeNPs group, (C) PTZ-injected group, (D) Co-treated group with SeNPs and PTZ, and (E) Co-treated group with sodium valproate (VPA) and PTZ. Degenerated neuron (white arrow). Scale bar = 80 μm.
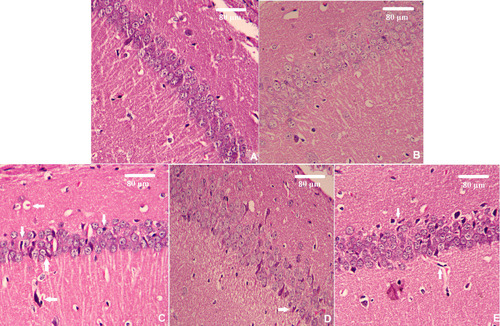
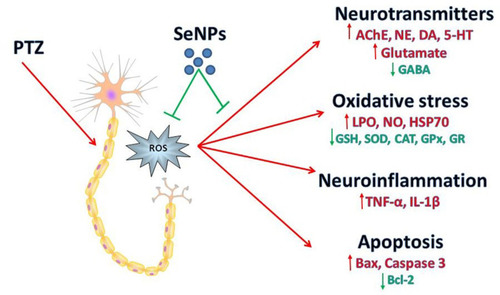
Figure 10 Schematic diagram shows the protective role of selenium nanoparticles (SeNPs) against epileptic model induced by pentylenetetrazole (PTZ).