Figures & data
Table 1 Factors and Responses in Response Surface-Central Composite Design
Table 2 Screening Results of Preparation Methods
Table 3 Box–Behnken Design and Results
Table 4 Variance Analysis of EE Regression Model
Table 5 Variance Analysis of DL Regression Model
Figure 1 Three-dimensional effect surface diagrams of encapsulation efficiency. (A) BO dosage to phospholipid–drug ratio (EE). (B) BO dosage to phospholipid–cholesterol ratio (EE). (C) Phospholipid–drug ratio to phospholipid–cholesterol ratio (EE). (D) BO dosage to phospholipid–drug ratio (DL). (E) BO dosage to phospholipid–cholesterol ratio (DL). (F) Phospholipid–drug ratio to phospholipid–cholesterol ratio (DL).
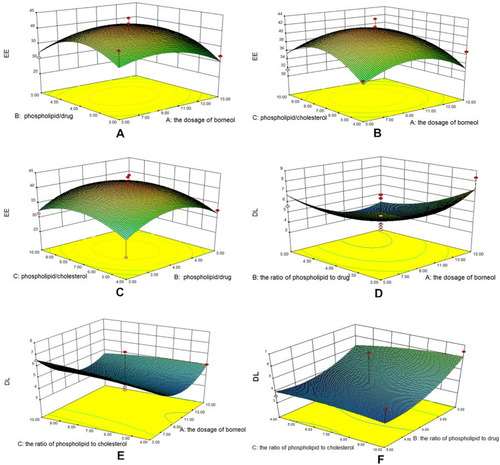
Table 6 The Results of Verification of the Predictive Model Test
Figure 2 Characterization of BO-BA-LP. (A) The size distribution of BO-BA-LP. (B) The transmission electron microscope photograph of BO-BA-LP.
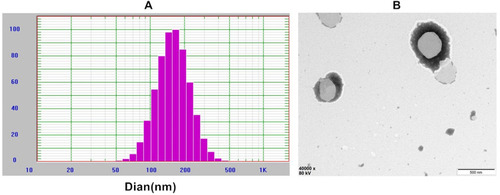
Table 7 The Results of Stability Test
Figure 3 In vitro release profiles of BA and BO-BA-LP.
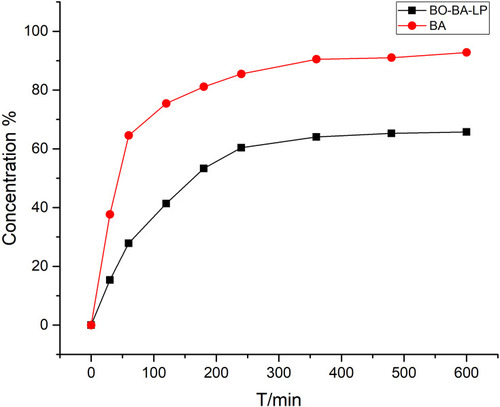
Table 8 Main Plasma Pharmacokinetic Parameters of BA and BA-LP After i.v. Administration to MCAO Rats at the Dosage of 25 Mg/Kg (n=5, mean±SD)
Figure 4 The plasma concentration-time profile of BA after i.v. administration of BA and BO-BA-LP (25 mg/kg).
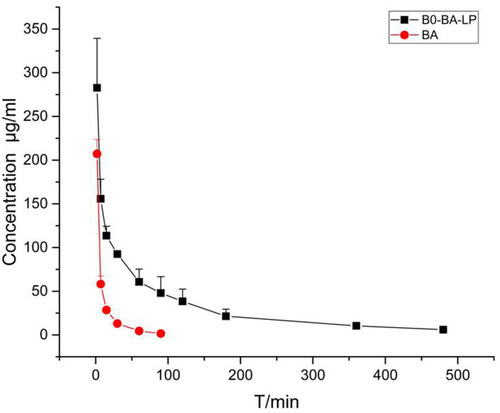
Table 9 Neurological Function Score and Infarction Rate in Different Groups (n=5)
Figure 5 The results of the TTC staining in each groups. (A) I/R group; (B) MCAO model with BA (25mg/kg); (C) MCAO model with BA-LP (25mg/kg); (D) MCAO model with BO-BA-LP (25mg/kg). The infarct area exhibited white, whereas the non-infarct areas were stained red.
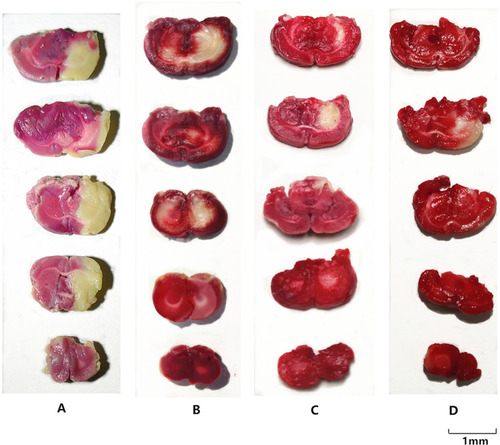
Figure 6 The HE staining of brain tissue slices with the treatment of sham (A), I/R (B), BA group (25 mg/kg, (C), BA-LP group (25 mg/kg; (D) and BO-BA-LP (25 mg/kg; (E) under 200-fold light microscope.
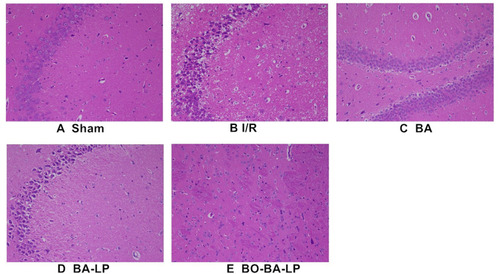
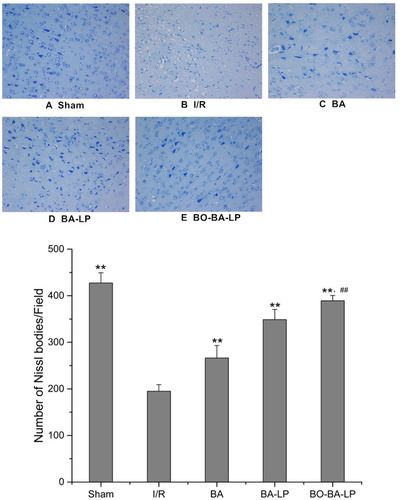
Figure 7 The Nissl staining of brain tissue slices with the treatment of sham (A), I/R (B), BA group (25 mg/kg, (C), BA-LP group (25 mg/kg; (D) and BO-BA-LP group (25 mg/kg; (E) under 200-fold light microscope. ** Extremely significant different from the I/R group at P < 0.01, ## Extremely significant different from the BA-LP group at P < 0.01.