
Figures & data
Figure 1 Excipient screening for NNEs. Consumption of NaOH by (A) oils, (B) surfactants, and (C) co-surfactants during the lipolysis; (D) Solubility of RAL in the excipients; (E) Emulsification efficiencies of surfactants; (F) Emulsification efficiencies of RH40 with different ratios of LA and IP.
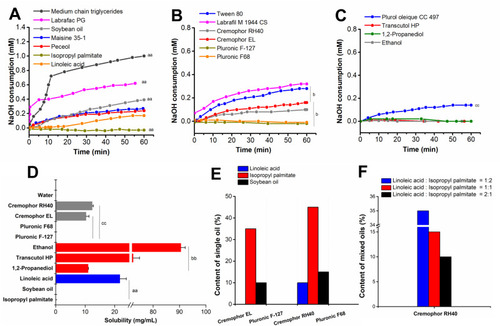
Table 1 Emulsification Efficiency of the Co-Surfactants (n = 3)
Table 2 Composition and Characteristics of NEs in the Different Formulations
Figure 2 Characterizations of RAL-NNE and RAL-LNE. Globule sizes (A), morphology (B) of RAL-NNE and RAL-LNE (× 15,000).
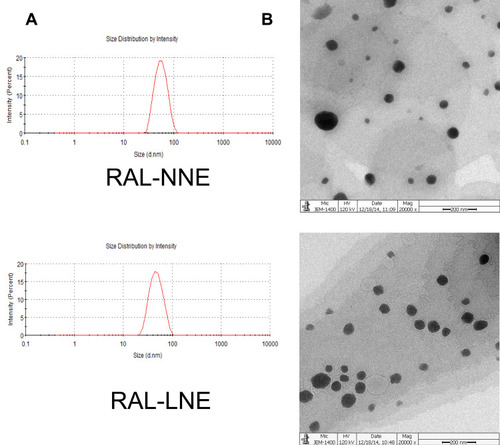
Figure 3 Stability of RAL-NNE in gastrointestinal situation. (A) Stability in different media after dilution; (B) Lipolysis curves of RAL-NNE and RAL-LNE; (C) Content change of RAL in the NNE and LNE during and after the lipolysis; (D) UGT-mediated metabolism rates of RAL solution, RAL-NNE, and RAL-LNE.
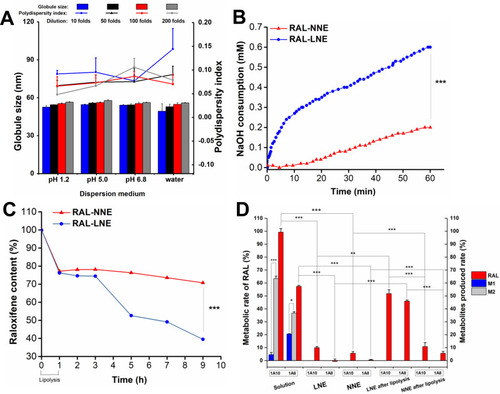
Table 3 Bioavailability Parameters and Lymphatic Transport of RAL in Rats (n = 5)
Figure 4 Plasma concentration-time profiles of RAL-LNE and RAL-NNE in rats (A) and pigs (B) after oral administration. Plasma concentration-time profiles of RAL-LNE (C) and RAL-NNE (D) in pigs.
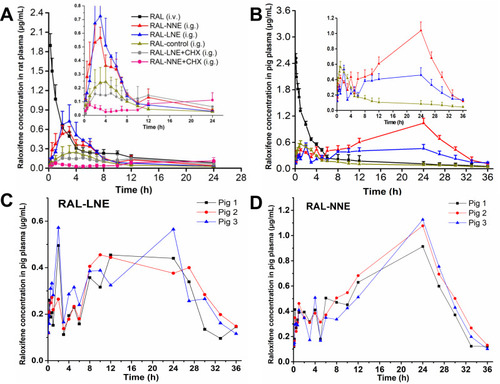
Table 4 Bioavailability Parameters of RAL in Pigs (n = 3)
Table 5 Intestinal Absorption Parameters (Ka and Peff) of the RAL-Loaded NNE Administered to Rats (n = 3)