Figures & data
Figure 1 Schematic diagram of the structure and action mechanism of E/PCF-NPs.
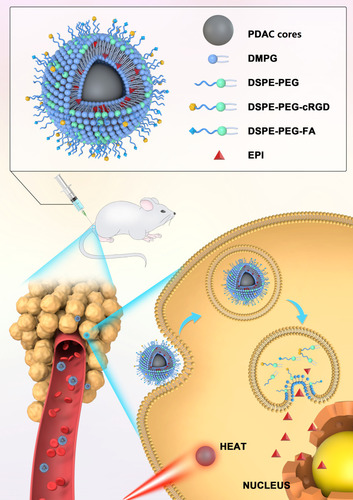
Figure 2 (A1) Temperature elevation of water and PDA-NPs at different concentrations as a function of irradiation time; (A2) Temperature change (ΔT) over 600 s versus the concentration of PDA-NPs; (A3) The photothermal response of the PDA-NPs for five repeat irradiations; (A4) Confocal images of calcein AM (green, live cells) and PI (red, dead cells) co-stained 4T1 cells treated with PDA-NPs after laser irradiation. (B) Cell survival rate of PDA-NPs. Concentrations of PDA from a-h are 15, 30, 60, 120, 480, and 960 µg/mL, respectively.
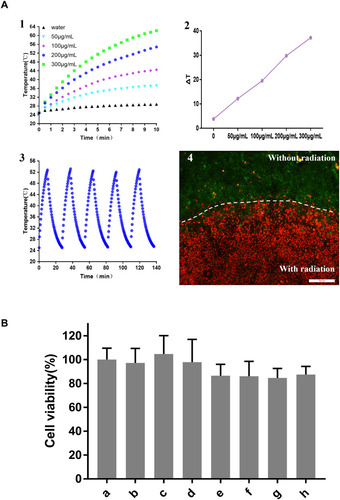
Figure 3 (A1) SEM image, (A2) TEM image, (A3) three-dimensional AFM topography image, (A4) AFM height image, and (A5) AFM three-dimensional height profile image of PDA-NPs. (A6) SEM image, (A7) TEM image, (A8) three-dimensional AFM topography image, (A9) AFM height image, and (A10) AFM three-dimensional height profile image of E/PCF-NPs. (B) Characterization of PDAC cores and EPI-containing preparations.
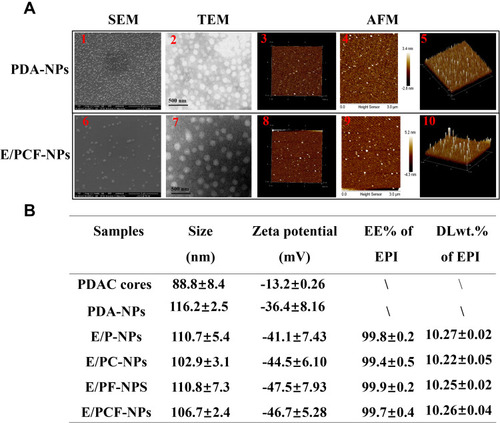
Figure 4 (A) The kinetics of cumulative release of EPI from E/PCF-NPs under different pH conditions (pH 7.4, 6.0, and 5.0) with or without NIR laser; (B) IC50 values for Free EPI, E/PC-NPs, E/PF-NPs, and E/PCF-NPs; (C) cell viability after PTT, a. control, b. PDA-NPs, c. E/PCF-NPs, d. EPI 25 μg/mL, e. EPI 200 μg/mL. ****p < 0.0001; (D) ROS generation was monitored using the mean DCF fluorescence when 4T1 cells were incubated with different preparations for 1 h in dark, followed by photo irradiation. ***p < 0.0005. (E) The ratio of NAD+/NADH was monitored for 4T1 cells incubated with different preparations for 24 h, followed by photo irradiation treatment. **p < 0.005, *p < 0.05.
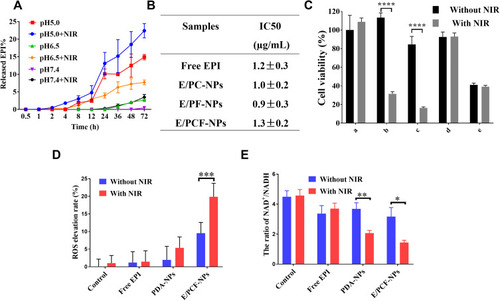
Figure 5 (A) In vitro CLSM images of 4T1 cells treated with EPI containing preparations for 4 and 12 h at 37°C, 5% CO2. All images show the nuclei (blue), EPI (red), and merged images. Scale bar; 50 μm; (B) quantitative results for the cellular uptake of EPI-loaded preparations expressed as a percentage of total cell number, ***p < 0.0005, **p < 0.005, *p < 0.05; (C) flow cytometry analysis of cellular uptake of EPI containing preparations in 4T1 cells.
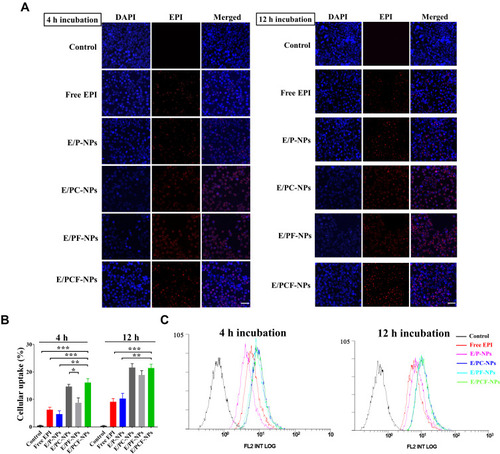
Figure 6 Apoptosis of 4T1 cells treated with different preparations by annexin V/PI staining using flow cytometry.
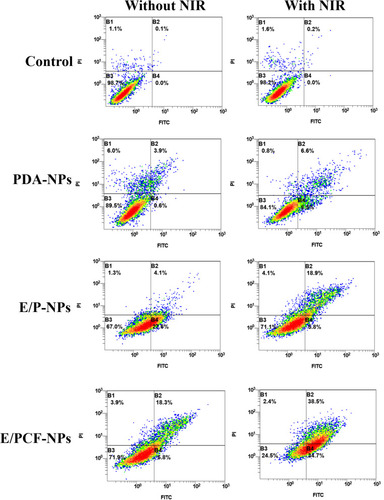
Table 1 Pharmacokinetic Parameters of EPI-Containing Preparations (Mean ± SD)
Figure 7 (A) Blood concentration–time profiles of formulations of EPI after intravenous injection at 10 mg/kg in rats (n=3). (B) Biodistribution of EPI from different preparations in tumors and major organs detected by UHPLC/MS at different time points after intravenous injection (n = 3), **p < 0.005, ***p < 0.0005.
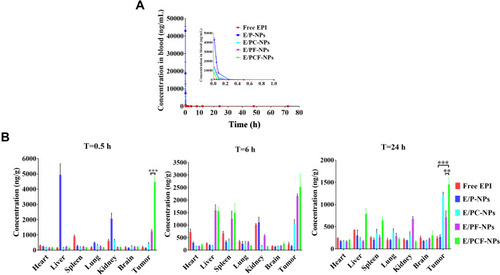
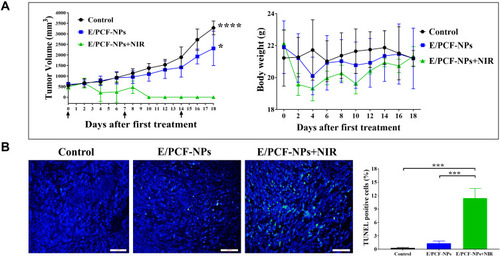
Figure 8 (A) Inhibition of early stage tumor growth in different groups with EPI at 5 mg/kg (n=4). Arrows indicate the days of injection. (B) Tumors were collected and photographed and (C) weighed; #vs Control group, p < 0.05; *vs E/PCF-NPs, p < 0.005; **vs E/PCF-NPs, p < 0.0001; δvs the same treatment without NIR, p < 0.005. (D) Body weight changes during treatment for each group.
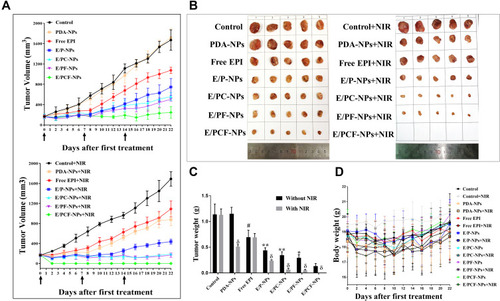
Figure 9 (A) Inhibition of late-stage tumor growth in different groups with EPI at 5 mg/kg (n = 4). Arrows indicate the days of injection. *vs E/PCF-NPs+NIR, p < 0.05; ****vs E/PCF-NPs+NIR, p < 0.0001. (B) TUNEL-positive cells (%) in tumors of each group (n = 4). ****p < 0.0001, ***p < 0.0005, *p < 0.05.