Figures & data
Figure 1 Image of hydrocolloid of gold nanoparticles visualized using transmission electron microscopy.
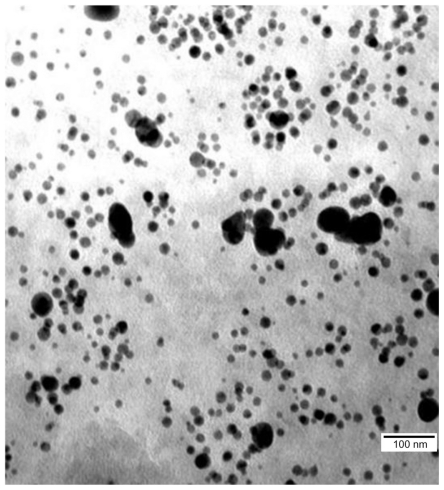
Table 1 Oligonucleotide sequences used in polymerase chain reaction
Table 2 Mortality and average weight of embryos and organs without (–) or with gold nanoparticles and heparan sulfate
Table 3 Biochemical indices in the blood serum of chicken embryos without (–) or with gold nanoparticles and heparan sulfate
Table 4 Morphometry of the breast muscle of chicken embryos without (–) or with gold nanoparticles and heparan sulfate
Figure 2 Images of nuclei (blue), stained with 4′,6-diamidino-2-phenylindole, in the cross-section of the breast muscle of a chicken embryo on day 20 of incubation visualized using a confocal microscope. (A) Control, (B) gold nanoparticles, (C) heparan sulfate, and (D) gold nanoparticles and heparan sulfate complex.
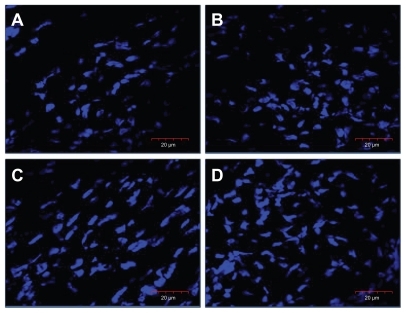
Figure 3 Images of the ultrastructure of the cross-section of the breast muscle of a chicken embryo on day 20 of incubation visualized using scanning electron microscopy (environmental scanning electron microscope mode). (A) Control, (B) gold nanoparticles, (C) heparan sulfate, and (D) gold nanoparticles and heparan sulfate complex.
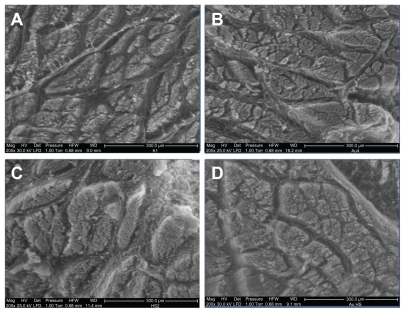
Figure 4 Images of the ultrastructure of the cross-section of the breast muscle of a chicken embryo on day 20 of incubation visualized using transmission electron microscopy. (A) Control, (B) gold nanoparticles, (C) heparan sulfate, and (D) gold nanoparticles and heparan sulfate complex.
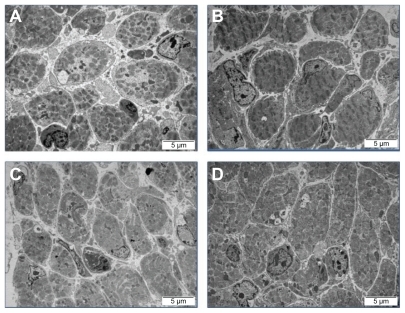
Figure 5 Images of Pax-7 positive nuclei, shown as an overlaid image of 4′,6-diamidino-2-phenylindole-stained nuclei (blue) and Pax-7 nuclei stained with fluorescein isothiocyanate (green), in the cross-section of the breast muscle of a chicken embryo on day 20 of incubation visualized using a confocal microscope. (A) Control, (B) gold nanoparticles, (C) heparan sulfate, and (D) gold nanoparticles and heparan sulfate complex.
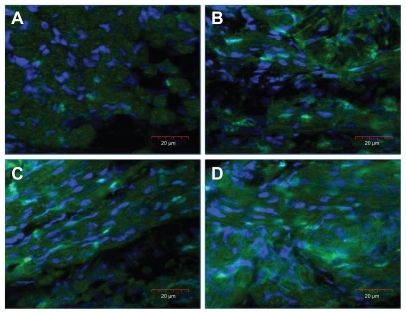
Table 5 Expression of PAX-7 and FGF-2 on the messenger ribonucleic acid level, normalized to ACTB, and on the protein level in the breast muscle of chicken embryos without (–) or with gold nanoparticles and heparan sulfate