Figures & data
Figure 1 Immobilization strategies of peptide and proteins to the tip or substrate. (A) p28 is bound to the amino-silanized tip via a PEG crosslinker. (B) p53, or alternatively its DBD or NTD, is immobilized on glass slides via a chemical platform involving sequentially linked amino-silane and glutaraldehyde, thus targeting aminic groups of lysine residues exposed on the protein surfaces (see Materials and methods section for details).
Abbreviations: APTES, 3-aminopropyl-triethoxysilane; DBD, DNA-binding domain; MAL, maleimide; NTD, N-terminal domain; PEG, polyethylene glycol.
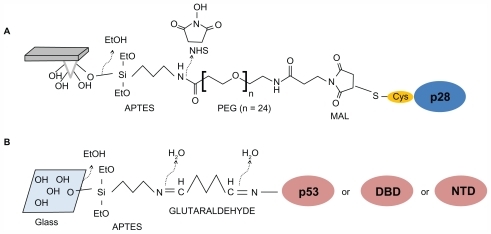
Figure 2 Schematic representation of a force–distance cycle carried out in the atomic force spectroscopy experiment. A ligand-functionalized tip is approached to a surface covered by immobilized receptor (point 1); the cantilever begins to deflect upward due to the ligand–receptor intermolecular repulsive forces (point 2); the two partners can interact, and when the cantilever applies the maximum contact force upon the substrate, the approaching phase is stopped (point 3); the cantilever begins to retract, reaches the baseline deflection and begins to bend downward due to the attractive interaction force displayed by the ligand–receptor complex (point 4); when the force exerted by the cantilever overcomes the stability of the complex bonds, the cantilever jumps off, returning to its initial position (point 5). See Funari et alCitation27 for a detailed description.
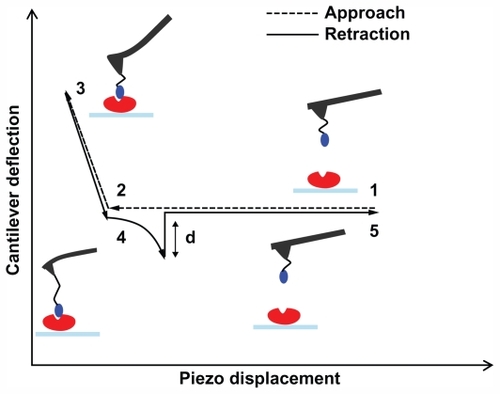
Figure 3 (A) Histograms of the unbinding forces for the p28/p53 complex before and after blocking. The most probable unbinding force value was determined from the maximum of the main peak of the histogram before blocking. All measurements were performed at a loading rate of 7 nN/s. (B) Histogram of the unbinding lengths for the p28/p53 complex, evaluated for the same collection of force curves as in (A). The continuous line is the fit by a Gaussian centered at 12 nm and with a standard deviation of 5.6 nm.
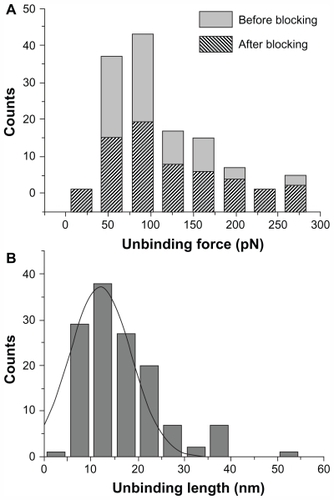
Figure 4 Plot of the unbinding forces versus the logarithm of the loading rates for the p28/p53 interaction. Statistical errors are given by standard deviation. The line is obtained by fitting the experimental data by the Bell-Evans model (EquationEquation 2(2) ).
Abbreviations: koff, dissociation rate constant; F*, the most probable unbinding force; xβ, width of the potential barrier along the direction of the applied force.
 ).Abbreviations: koff, dissociation rate constant; F*, the most probable unbinding force; xβ, width of the potential barrier along the direction of the applied force.](/cms/asset/4d5c9b04-b830-4d68-8ac1-c922baccb4f3/dijn_a_26155_f0004_b.jpg)
Figure 5 (A) Histograms of the unbinding forces for the p28/DBD complex before and after blocking. The most probable unbinding force value was determined from the maximum of the main peak of the histogram before blocking. All measurements were performed at a loading rate of 7 nN/s. (B) Histogram of the unbinding lengths for the p28/DBD interaction, evaluated for same collection of force curves as in (A). The continuous line is the fit by a Gaussian centered at 12.1 nm and with a standard deviation of 3.7 nm.
Figure 6 Plot of the unbinding forces versus the logarithm of the loading rates for the p28/DBD complex. Statistical errors are given by standard deviation. The line is obtained by fitting the experimental data by the Bell-Evans model (EquationEquation 2(2) ).
Abbreviations: DBD, DNA-binding domain; koff, dissociation rate constant; F*, the most probable unbinding force; xβ, width of the potential barrier along the direction of the applied force.
 ).Abbreviations: DBD, DNA-binding domain; koff, dissociation rate constant; F*, the most probable unbinding force; xβ, width of the potential barrier along the direction of the applied force.](/cms/asset/bbe27a54-d8a0-452c-88b9-51b07e7fcb78/dijn_a_26155_f0006_b.jpg)
Abbreviation: DBD, DNA-binding domain.
 ).Abbreviations: DBD, DNA-binding domain; koff, dissociation rate constant; F*, the most probable unbinding force; xβ, width of the potential barrier along the direction of the applied force.Display full sizeAbbreviation: DBD, DNA-binding domain.](/cms/asset/ce8cbb39-3e25-49fe-af73-44d4452634b8/dijn_a_26155_f0005_b.jpg)
Figure 6 Plot of the unbinding forces versus the logarithm of the loading rates for the p28/DBD complex. Statistical errors are given by standard deviation. The line is obtained by fitting the experimental data by the Bell-Evans model (EquationEquation 2(2) ).
Abbreviations: DBD, DNA-binding domain; koff, dissociation rate constant; F*, the most probable unbinding force; xβ, width of the potential barrier along the direction of the applied force.