Figures & data
Figure 1 Cytotoxicity assessment of ZnO NPs on leukemic and normal cells; and dissolution analysis of the NPs in culture medium. MTT assay was used to measure the viability of K562 cells (A) and PBMCs (B) post treatment with different concentrations of ZnO NPs for 120 hours. MTT assay was also used to determine the viability of K562 cells post incubation with 10 μg/mL for five different periods of time (C). Dissolution analysis was conducted to determine the concentration of released Zn ions from ZnO NPs to the culture medium RPMI 1640 (D). Annexin V-FITC and propidium iodide (PI) with flow cytometer were used to identify the kind of death caused by ZnO NPs (40 μg/mL) in K562 cells (E). The data of flow cytometer were presented using column graph (F). All experiments were conducted in triplicate. PBMCs: peripheral blood mononuclear cells. Asterisk symbol was used to define p values; p ≤ 0.01 is ** and p ≤ 0.001 is ***.
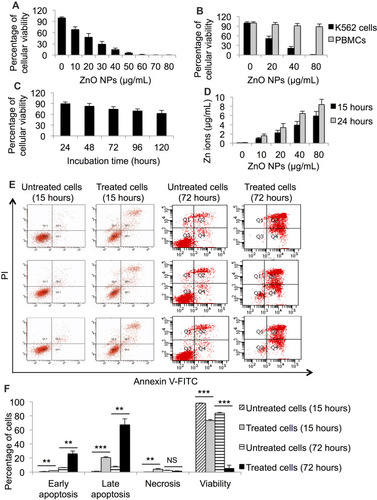
Figure 2 A transcriptomic signature was associated with ZnO NPs-treated K562 cells. Volcano plot shows differentially expressed genes (DEGs: FC≥4; p≤0.008; corrected p≤0.05) in the ZnO NPs-treated K562 cells versus untreated K562 cells (A). Hierarchical cluster analysis with heatmap presentation was performed on the DEGs (B). The color range represents the normalized signal value of probes (log2 transformation and 75 percentile shift normalization).
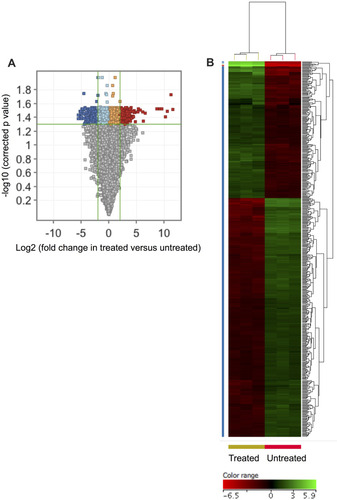
Table 1 Pathway Enrichment Analysis of the Differentially Expressed Genes (DEGs: FC≥4; p≤0.008; Corrected p≤0.05) in the ZnO NPs-Treated K562 Compared with the Untreated K562 Cells
Figure 3 Over-expressed genes in the ZnO NPs-treated K562 cells compared with the untreated K562 cells. Hierarchical cluster analysis with heatmap presentation was conducted on the over-expressed genes (FC≥4; p≤0.008; corrected p≤0.05) that significantly over-represented the biological processes “cellular response to zinc ions and negative regulation of growth” (A) and “response to chemicals” (B). The color range represents the normalized signal value of probes (log2 transformation and 75 percentile shift normalization).
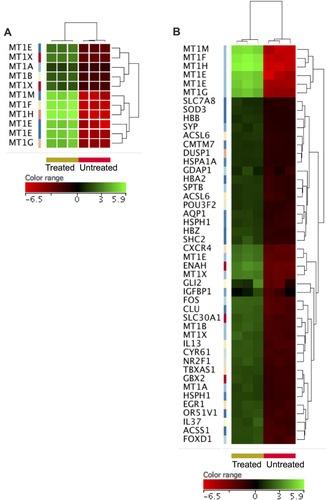
Figure 4 Down-expressed genes in the ZnO NPs-treated K562 cells compared with the untreated K562 cells. Hierarchical cluster analysis with heatmap presentation was applied on the down-expressed genes (FC≥4; p≤0.008; corrected p≤0.05) that significantly enriched the biological processes “cell activation” (A), “positive regulation of mononuclear cell proliferation” (B), “positive regulation of cell adhesion” (C) and “positive regulation of cell migration” (D). The color range represents the normalized signal value of probes (log2 transformation and 75 percentile shift normalization).
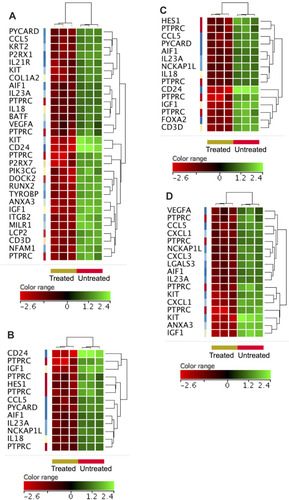
Figure 5 ZnO NPs targeted pathways that promote cellular proliferation and survival. ZnO NPs reduced the expression of genes (FC≥4; p≤0.008; corrected p≤0.05) that significantly enriched “positive regulation of tyrosine phosphorylation of STAT protein” (IGF1, IL18, IL23A, KIT, CCL5 and HES1), “positive regulation of receptor signaling pathway via JAK-STAT” (IGF1, IL18, IL23A, KIT, CCL5 and HES1) and “positive regulation of phosphatidylinositol 3-kinase signaling” (IGF1, PIK3CG, IL18, KIT, CCL5 and UNC5B). The gene expression data were shown from three ZnO NPs-treated K562 samples and three untreated K562 samples. The normalized signal value of probes was generated by log2 transformation and 75 percentile shift normalization of the raw data.
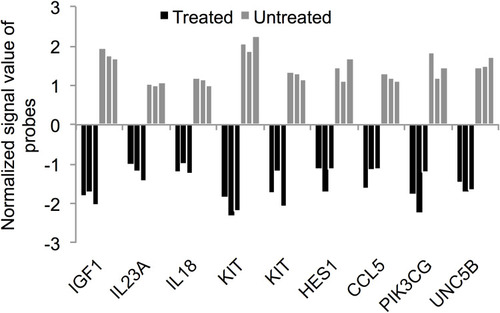
Figure 6 Expression of cytokine and cytokine receptor genes in the ZnO NPs-treated K562 cells compared with the untreated K562 cells. The fold change (FC) of the gene expression was based on the data that were recorded in three ZnO NPs-treated K562 samples and three untreated K562 samples. All FC data had p≤0.007 and corrected p≤0.05.
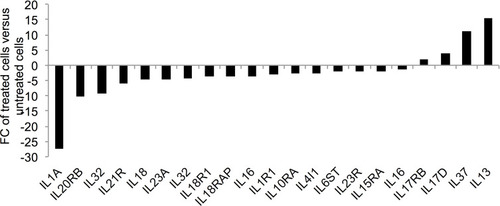
Figure 7 Network of differentially expressed genes (DEGs) is associated with molecular transport and inflammatory response. A network of 35 genes was constructed to understand the cross-talk between genes and functional relevance of this network. Red colored nodes indicated genes from the DEGs, whereas nodes with no color were not from the DEGs that was used for generating this network. Arrows show the direction of effect. The numbers under the genes are as follows from the top to bottom: p value, corrected p value, fold change (FC) of the DEGs, and log FC.
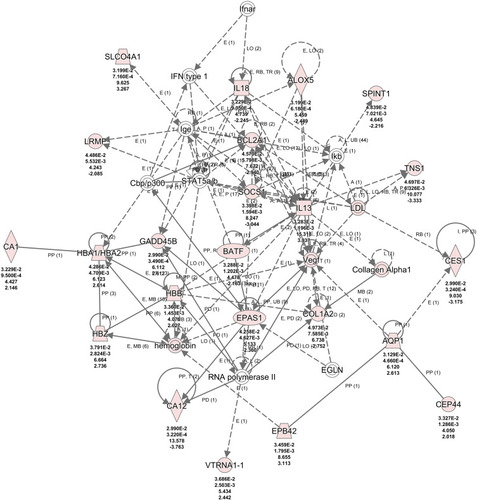
Figure 8 K562 cells altered the expression of their oxidative stress responsive genes in response to the treatment with ZnO NPs. Hierarchical cluster analysis with heatmap presentation demonstrated changes in the expression of oxidative stress responsive genes in the ZnO NPs-treated K562 cells as opposed to the untreated K562 cells. The altered gene expression was identified with fold change ≥1.5, p≤0.05 and corrected p≤0.1. The color range represents the normalized signal value of probes (log2 transformation and 75 percentile shift normalization)
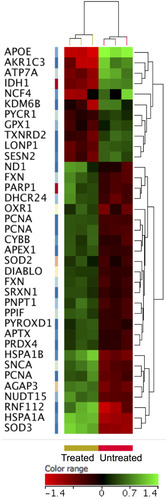
Figure 9 ZnO NPs induced changes in the expression of apoptotic genes in K562 cells. Hierarchical cluster analysis and heatmap presentation showed altered expression of anti-apoptotic genes (A) and pro-apoptotic genes (B) in the ZnO NPs-treated K562 cells compared with the untreated K562 cells. All differentially expressed genes were found with fold change ≥1.5, p≤0.05 and corrected p≤0.1. The color range represents the normalized signal value of probes (log2 transformation and 75 percentile shift normalization).
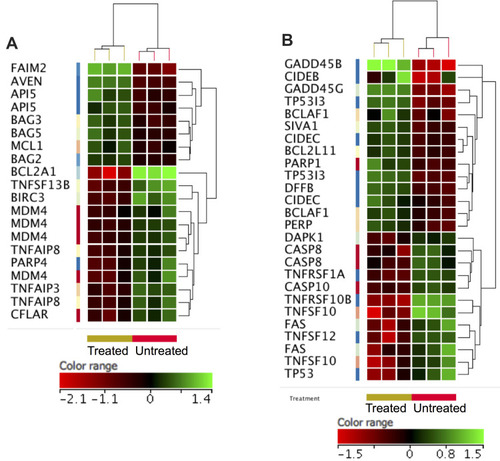
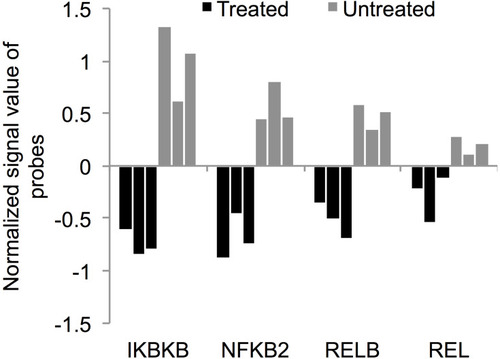
Figure 10 ZnO NPs targeted NF-κB pathway in K562 cells. The treatment with ZnO NPs reduced the expression of NF-κB pathway activator IKBKB (FC=3.4, p=0.007; corrected p=0.05) and the NF-κB subunits: NFKB2 (FC=2.42; p=0.001; corrected p=0.03), RELB (FC=2; p=0.01; corrected p=0.06) and REL (FC=1.42; p=0.03; corrected p=0.09). The gene expression data were obtained from three samples of ZnO NPs-treated K562 cells and three samples of untreated K562 cells. The normalized signal value of probes was generated by log2 transformation and 75 percentile shift normalization of the raw data.