Figures & data
Table 1 Physicochemical Characterization of SiNPs
Figure 1 Representative recordings showing the effects of SiNP-100 and SiNP-20 on the transmembrane potential (TMP) of cultured neonatal mice ventricular myocytes. Note that both SiNPs did not affect the resting potential (RP), but substantially affected the action potential (AP) in a concentration- and time-dependent manner. SiNP-20 at 10−8 g/mL had no effect on the TMP (not shown).
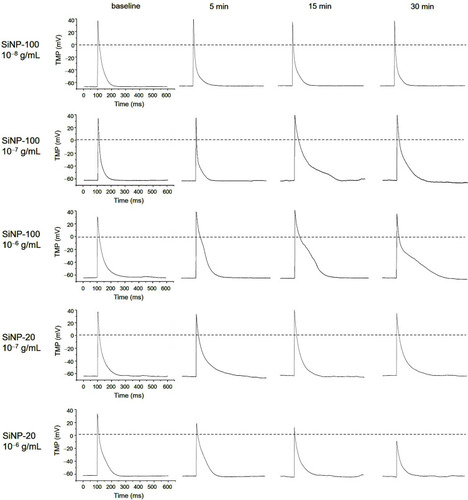
Figure 2 Statistical results showing the acute effects of SiNPs on the TMP parameters of mouse cardiomyocytes in vitro. (A) SiNP-100 at 10−8–10−6 g/mL and exposure for 5–30 min. (B) SiNP-20 at 10−7 and 10−6 g/mL and exposure for 5–30 min. *P<0.05, **P<0.01, ***P<0.001, n=5 cells for each SiNP concentration.
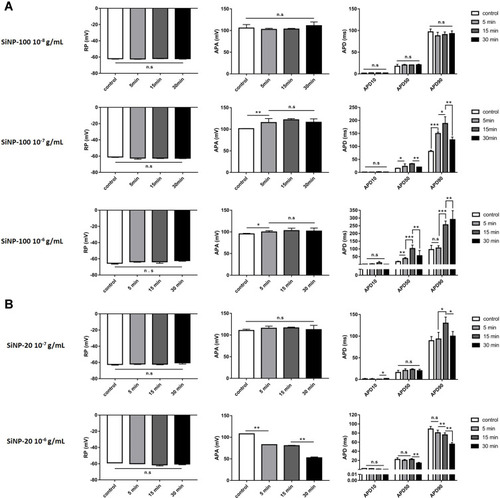
Figure 3 Effects of SiNP-100 and SiNP-20 (both 10−6 g/mL) on the IK1 channels of cultured neonatal mice ventricular myocytes. (A and B) typical IK1 current tracings at baseline and after exposure to SiNP-100 and SiNP-20 for 5–30 min. (C and D) corresponding I–V curves of IK1 channels at baseline (control) and after exposure to SiNP-100 and SiNP-20, respectively. (E and F) activation curves of IK1 channels at baseline and after exposure to SiNP-100 and SiNP-20, respectively. N=5 cells for each SiNP concentration.
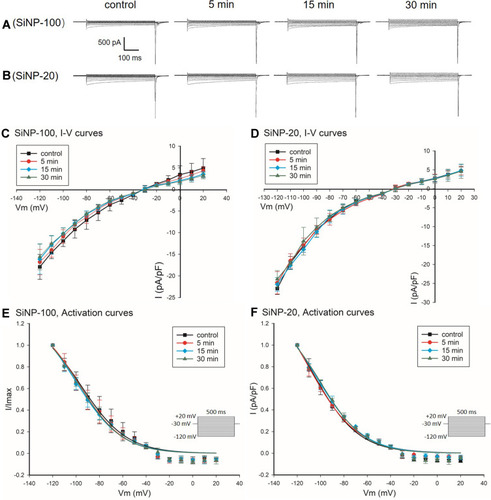
Figure 4 Effects of SiNP-100 and SiNP-20 (both 10−6 g/mL) on the INa channels of cultured neonatal mice ventricular myocytes. (A and B) typical INa currents recorded at baseline and after exposure to SiNP-100 or SiNP-20 for 5–30 min. (C and D) corresponding I–V curves of INa channels at baseline and after exposure to SiNP-100 and SiNP-20, respectively. **P<0.01, ***P<0.001 vs baseline (control). (E and F) activation curves of INa channels at baseline and after exposure to SiNP-100 and SiNP-20, respectively. N = 6 cells for each SiNP concentration.
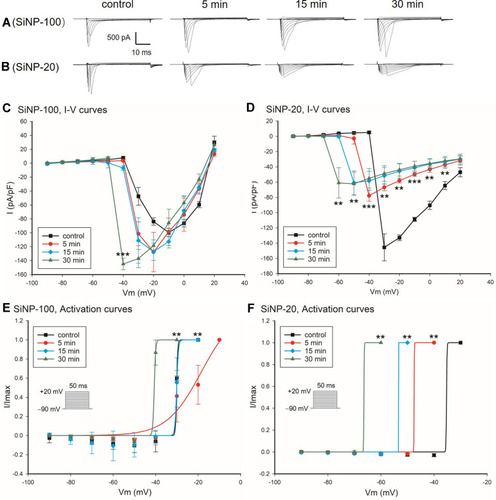
Figure 5 Effects of SiNP-100 and SiNP-20 (both 10−6 g/mL) on the inactivation kinetics of INa channels in cultured neonatal mice ventricular myocytes. (A and B) typical INa induced by the stimulating protocol for checking inactivation at baseline and after exposure to SiNP-100 and SiNP-20 for 5–30 min. (C and D) inactivation curves of INa channels at baseline (control) and after exposure to SiNP-100 and SiNP-20, respectively. **P<0.01, ***P<0.001 vs control, n=6 cells for each SiNP concentration.
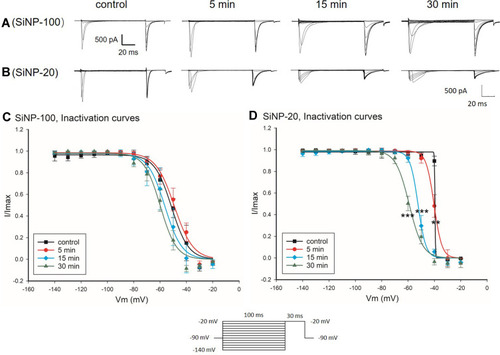
Figure 6 Effects of SiNP-100 and SiNP-20 (both 10−6 g/mL) on the Ito channels in cultured neonatal mice ventricular myocytes. (A and B) typical Ito currents at baseline (control) and after exposure to SiNP-100 and SiNP-20, respectively, for 5–30 min. (C and D) corresponding I–V curves of Ito channels at baseline and after exposure to SiNP-100 and SiNP-20, respectively. (E and F) activation curves of Ito channels at baseline and after exposure to SiNP-100 and SiNP-20, respectively. *P<0.05, **P<0.01, ***P<0.001 vs control. N = 7 cells for each SiNP concentration.
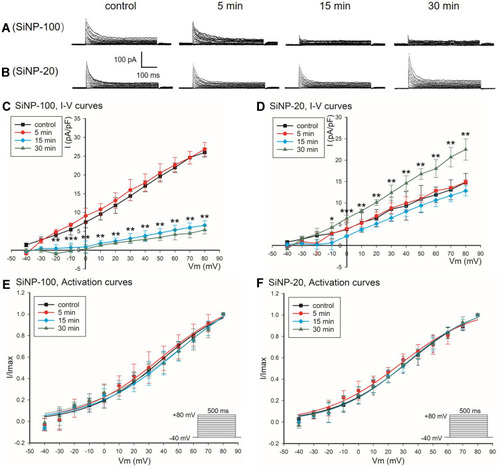
Figure 7 The calcium mobilizing effects of SiNPs on cultured neonatal mice cardiomyocytes in vitro. Cardiomyocytes were loaded with Fura-2AM and then exposed to SiNPs at serial concentrations and different exposure times. The fluorescence intensities at 340/380 nm were detected with a fluorescence microplate reader. (A) SiPN-100. (B) SiNP-20. *P<0.05, **P<0.01, ***P<0.001 vs control. Each experiment was performed in six independent replicates, and three parallel wells were used for each concentration.
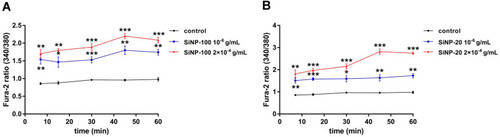
Table 2 Statistical Summary of Cardiac Arrhythmias within 90 min After Intravenous Exposure to SiNPs in Mice in vivo
Figure 8 Typical ECGs showing the arrhythmogenic effects of SiNP-100 (A) and SiNP-20 (B) in adult mice in vivo. Both SiNP-100 and SiNP-20 induced sinus tachycardia, ventricular tachyarrhythmias (PVC or VT), complete atrio-ventricular conduction block (AVB), cardiac asystole and sudden cardiac death in a dose- and time-dependent manner. Note that the dose of SiNP-100 (6 mg/kg) was much lower than the dose of SiNP-20 (30 mg/kg) beginning to induce cardiac asystole, suggesting that SiNP-100 was more toxic than SiNP-20.
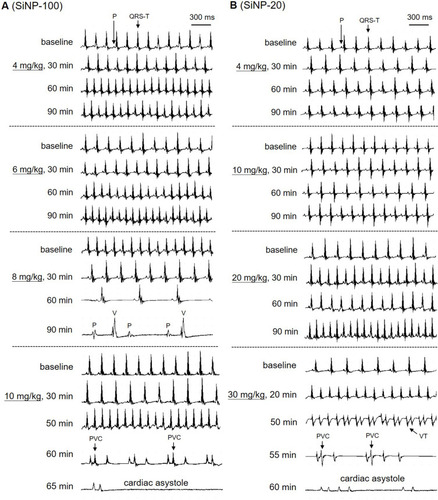
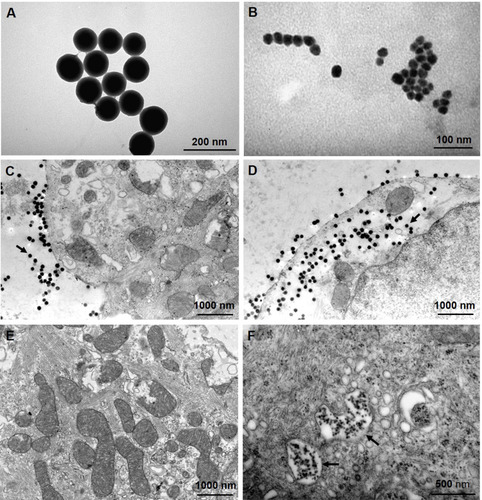
Figure 9 TEM images showing the morphology of SiNPs and their endocytosis by cultured neonatal mice ventricular myocytes. (A and B) TEM images of SiNP-100 and SiNP-20 in culture medium. (C) cells exposing to SiNP-100 for 10 min, SiNP-100 located at the extracellular space (arrow), and no endocytosis was observed. (D) cells exposing to SiNP-100 for 1 h, substantial amounts of SiNP-100 were observed inside the cell (arrow). (E) cell exposing to SiNP-20 for 10 min, no SiNP-20 endocytosis was observed. (F) cell exposing to SiNP-20 for 1 h, SiNP-20 was endocytosed and located mainly inside vesicles (arrows).