Figures & data
Figure 1 (A) Time course of carboplatin loading by passive equilibration method into different liposomes; (B) representative cryogenic transmission electron microscopy images of empty and carboplatin-loaded liposomes* from at least three liposome batches.
Notes: Results shown are the mean plus or minus the standard error of the mean obtained from at least three independent experiments; ♦ = DPPC/DSPE-PEG1000 [molar ratio, 95:5], or DPPC-NT); *■ = DPPC/DSPE-PEG1000/DSPE-PEG2000-folate [molar ratio, 95:4.8:0.2], or DPPC-FRT); ▴ = DSPC/DSPE-PEG1000 [molar ratio, 95:5], or DSPC-NT); ● = DSPC/DSPE-PEG1000/DSPE-PEG2000-folate (molar ratio, 95:4.8:0.2; DSPC-FRT).
![Figure 1 (A) Time course of carboplatin loading by passive equilibration method into different liposomes; (B) representative cryogenic transmission electron microscopy images of empty and carboplatin-loaded liposomes* from at least three liposome batches.Notes: Results shown are the mean plus or minus the standard error of the mean obtained from at least three independent experiments; ♦ = DPPC/DSPE-PEG1000 [molar ratio, 95:5], or DPPC-NT); *■ = DPPC/DSPE-PEG1000/DSPE-PEG2000-folate [molar ratio, 95:4.8:0.2], or DPPC-FRT); ▴ = DSPC/DSPE-PEG1000 [molar ratio, 95:5], or DSPC-NT); ● = DSPC/DSPE-PEG1000/DSPE-PEG2000-folate (molar ratio, 95:4.8:0.2; DSPC-FRT).](/cms/asset/4ddfa283-55c3-46cf-9024-a641b2d6c86c/dijn_a_26172_f0001_b.jpg)
Figure 2 Cumulative release of carboplatin from various liposomes at 37°C under sink conditions (1:1000 v/v) in (A) phosphate-buffered saline and (B) 50% (v/v) fetal bovine serum.
Notes: Results shown are the mean plus or minus the standard error of the mean obtained from at least three independent experiments; ♦ = DPPC/DSPE-PEG1000 [molar ratio, 95:5], or DPPC-NT); ■ = DPPC/DSPE-PEG1000/DSPE-PEG2000-folate [molar ratio, 95:4.8:0.2], or DPPC-FRT); ▴ = DSPC/DSPE-PEG1000 [molar ratio, 95:5], or DSPC-NT); ● = DSPC/DSPE-PEG1000/DSPE-PEG2000-folate (molar ratio, 95:4.8:0.2; DSPC-FRT).
![Figure 2 Cumulative release of carboplatin from various liposomes at 37°C under sink conditions (1:1000 v/v) in (A) phosphate-buffered saline and (B) 50% (v/v) fetal bovine serum.Notes: Results shown are the mean plus or minus the standard error of the mean obtained from at least three independent experiments; ♦ = DPPC/DSPE-PEG1000 [molar ratio, 95:5], or DPPC-NT); ■ = DPPC/DSPE-PEG1000/DSPE-PEG2000-folate [molar ratio, 95:4.8:0.2], or DPPC-FRT); ▴ = DSPC/DSPE-PEG1000 [molar ratio, 95:5], or DSPC-NT); ● = DSPC/DSPE-PEG1000/DSPE-PEG2000-folate (molar ratio, 95:4.8:0.2; DSPC-FRT).](/cms/asset/e423d6f6-70b3-4812-a016-cb5d512c5578/dijn_a_26172_f0002_b.jpg)
Figure 3 (A) Cellular accumulation of DiI-labeled folate receptor-targeted (FRT) liposomes (i), nontargeted (NT) liposomes (ii), and FRT liposomes in the presence of 1 mM of free folic acid (iii) in IGROV-1 cells after 24 hours. (B) Cellular platinum (Pt) content in IGROV-1 cells after treatment with free carboplatin, carboplatin-loaded NT liposomes, or carboplatin-loaded FRT liposomes.
Notes: Images are representative of three independent experiments; data represent the mean plus or minus the standard error of the mean obtained from three independent experiments.
Abbreviation: ppb, parts per billion.
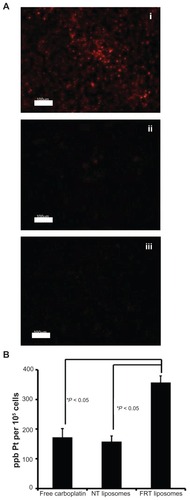
Table 1 IC50 values of free carboplatin, carboplatin-loaded nontargeted (NT) liposomes, and carboplatin-loaded folate receptor-targeted (FRT) carboplatin liposomes in IGROV-1 cells
Figure 4 Viability of IGROV-1 cells upon 72-hour exposure to free carboplatin (), carboplatin-loaded nontargeted liposome (♦), carboplatin-loaded folate receptor-targeted liposome (■), and carboplatin-loaded folate receptor-targeted liposome with 1 mM folic acid (×).
Note: Data represent the mean plus or minus the standard error of the mean obtained from five independent experiments.
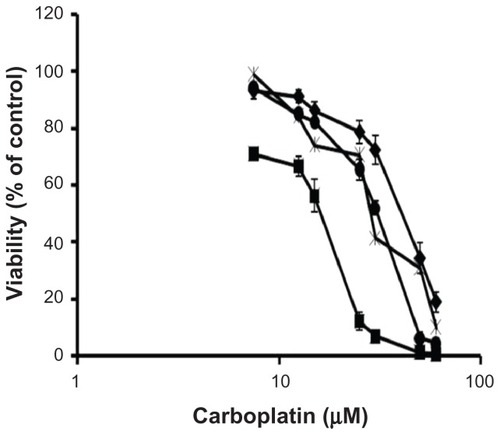
Table 2 In vivo efficacy of intraperitoneal administration of carboplatin in various forms in intraperitoneal IGROV-1 ovarian tumor xenograft
Figure 5 (A) Kaplan–Meier survival curves of mice bearing intraperitoneal IGROV-1 ovarian tumor xenograft treated with saline (blue), free carboplatin (green), carboplatin-loaded nontargeted (NT) liposomes (red) and carboplatin-loaded folate receptor-targeted (FRT) liposomes (black). Each study group comprised six animals. (B) Plasma drug concentrations (conc) in animals treated with various intraperitoneal carboplatin formulations at a dose of 15 mg/kg. Carboplatin was administered for a total of six doses, and plasma samples were collected 24 hours after doses 2, 4, and 6.
Notes: Results shown in panel (B) were obtained from at least three mice. The exception to this was dose 6, with n = 2 and n = 1 for free drug and carboplatin-loaded NT liposome groups, respectively.
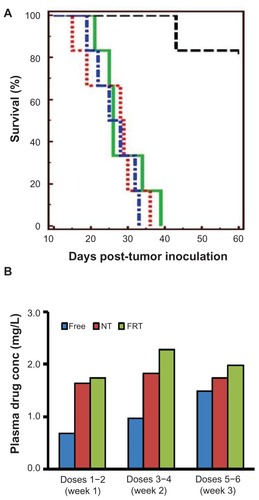
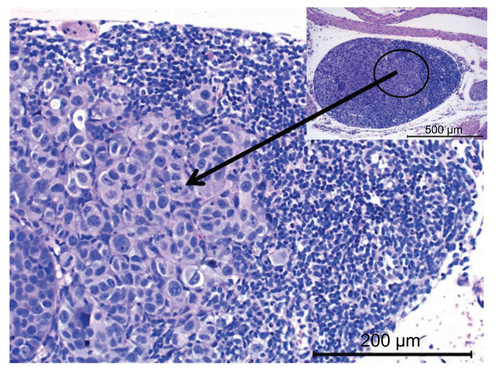
Figure 6 Histopathological evaluation of excised lung tissue (top) and liver tissue (bottom) indicating the presence of cancer cells in mice treated with (A) saline, (B) free carboplatin, and (C) carboplatin-loaded nontargeted liposome. Mice treated with carboplatin-loaded folate receptor-targeted liposome (D) that survived the study period did not show any presence of cancer cells.
Notes: Representative images are shown from at least three animals, with arrows indicating the presence of cancer cells.
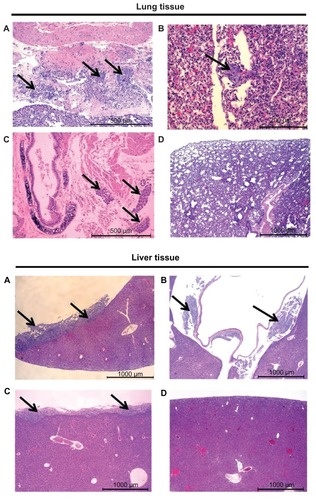
Figure S1 Changes in body weight in various study groups, including saline (◆), free carboplatin (■), carboplatin-loaded nontargeted liposome (▴), carboplatin-loaded folate receptor-targeted liposme (●), and healthy control mice (×).
Notes: Body weights were measured at least three times a week, with the arrows indicating the intraperitoneal administration of treatment. Results shown are the mean plus or minus the standard error of the mean obtained from at least three mice.
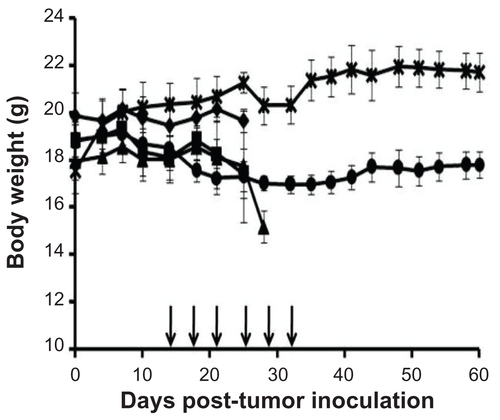
Figure S2 Histopathological evaluation indicating the presence of cancer cells in mediastinal lymph node of saline control.
Notes: Arrow indicates the presence of cancer cells. Representative image of lymph node metastasis is presented.