Figures & data
Figure 1 Images of NCMs and test strip design.
Notes: (A) SEM images of the NCM cross-sections, showing the difference in pore structure. (B) Image of a strip from IVIS-50 instrument showing surface topography. Upper strip represents native image. Lower strip represents computer modeling of FNDP-NV locations: (a) application zone marked in green, (b) migration zone in pink with test (T) and control lines (C) shown, (c) absorption pad marked in yellow, which serves as a sink for unbound particles. The blue arrow indicates the direction of FNDP-NV flow.
Abbreviations: SEM, scanning electron microscope; NCM, nitrocellulose membrane; FNDP-NV, fluorescent nanodiamond particles with NV active centers.
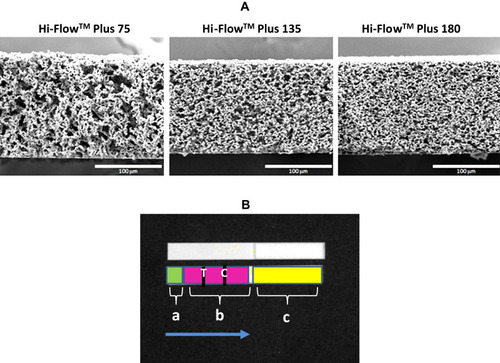
Table 1 Z-Average and ζ-Potential of FNDP-NV Preparations Suspended in Water and Buffers
Figure 2 Verification of antibody conjugation and reactivity on FNDP-NV-COOH by ELISA.
Notes: hIgG and mAb c13C6 were covalently coupled to FNDP-NV-COOH. BSA was passively adsorbed to the FNDP-NV-COOH surface. In (A) and (B), ELISA was performed by direct binding of GAH-IgG AP conjugate to immobilized particles. (A) Recognition of hIgG coupled to FNDP-NV with diameters of 800, 400, or 200 nm. One-way ANOVA for the difference between 200 nm and 400/800 nm particles (*) P<0.001, (**) P<0.01. (B) Comparison of hIgG and mAb c13C6 coupled to FNDP-NV-200nm. FNDP-NV-200nm/BSA was the control. (C) Sandwich ELISA for rGP was used to measure antibody binding activity. FNDP-NV-200nm-c13C6 and FNDP-NV-200nm/BSA at 0.1 mg/mL were immobilized on a 96-well plate and then incubated with rGP. Bound rGP was detected using rabbit polyclonal anti-rGP, followed by GAR-IgG AP conjugate. Error bars represent SD of three independent experiments.
Abbreviations: FNDP-NV-COOH, fluorescent nanodiamond particles with NV active centers, surface-functionalized with free carboxyl groups; FNDP-NV-hIgG, fluorescent nanodiamond particles with NV active centers, coupled to human immunoglobulin G; FNDP-NV-c13C6, fluorescent nanodiamond particles with NV active centers, coupled to chimeric monoclonal antibody clone c13C6; FNDP-NV-COOH/BSA, fluorescent nanodiamond particles with NV active centers, passively adsorbed with bovine serum albumin; ELISA, enzyme-linked immunosorbent assay; hIgG, human immunoglobulin G; GAH-IgG, goat anti-human immunoglobulin G; AP, alkaline phosphatase; mAb, monoclonal antibody; GAR-IgG, goat anti-rabbit IgG; SD, standard deviation.
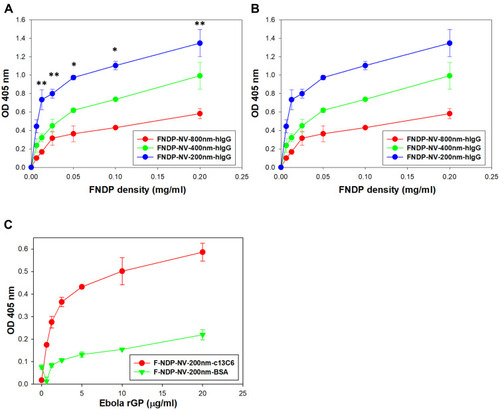
Figure 3 Quantitation of FNDP-NV-hIgG fluorescence on NCM strips.
Notes: The FNDP-NV indicated in each panel was run up the NCM strip in MB. After drying, strips were scanned by IVIS-50. The image of each strip was partitioned into AZ and MZ, and the fluorescent signals were determined. In each panel, the red bar represents the total fluorescence of the strip. Green bars represent the fluorescence of the AZ. Blue bars represent the fluorescence of the MZ. Blank strips were used for background subtraction. Error bars represent SD of the mean of three independent strips. (*) P<0.05 One-way ANOVA; (**) P<0.005 One-way ANOVA.
Abbreviations: FNDP-NV-hIgG, fluorescent nanodiamond particles with NV active centers, coupled to human immunoglobulin G; NCM, nitrocellulose membrane; HiF, Hi-FlowTM Plus; AZ, application zone; MZ, migration zone; SD, standard deviation.
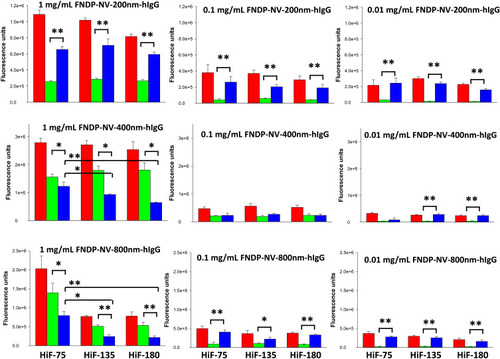
Table 2 Ratio of Different Sizes (200, 400, 800 nm) of FNDP-NV-hIgG Fluorescence in the MZ to Fluorescence in the AZ Measured by IVIS-50
Figure 4 Ratio of MZ to AZ fluorescence after mobilization of FNDP-NV-hIgG on NCMs.
Notes: Ratios of MZ to AZ were calculated from the data presented in . Values for the 1 mg/mL FNDP-NV-hIgG concentration only are graphed. Pink bars represent HiF-75, yellow bars HiF-135, and cyan bars HiF-180. (*) P<0.001 One-way ANOVA.
Abbreviations: MZ, migration zone; AZ, application zone; FNDP-NV-hIgG, fluorescent nanodiamond particles with NV active centers, coupled to human immunoglobulin G; NCM, nitrocellulose membrane; HiF, Hi-FlowTM Plus; SD, standard deviation.
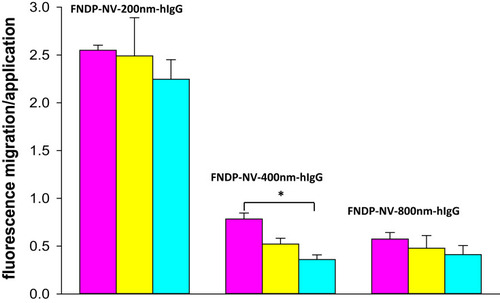
Figure 5 Effect of line location on binding of FNDP-NV-200nm-hIgG.
Note: (A) HiF-75 NCM strips (6 cm long) were printed with GAH-IgG at 1 µg/cm of line length, at the distances from the top of the strip shown on the abscissa. Strips were run in duplicate and imaged using IVIS-50 with 30 sec exposure. (B) Fluorescence intensity of lines in (A). Bars represent the mean of each pair of strips.
Abbreviations: FNDP-NV-200nm-hIgG, fluorescent nanodiamond particles with NV active centers, 200nm diameter, coupled to human immunoglobulin G; NCM, nitrocellulose membrane; HiF, Hi-FlowTM Plus; GAH-IgG, goat anti-hIgG.
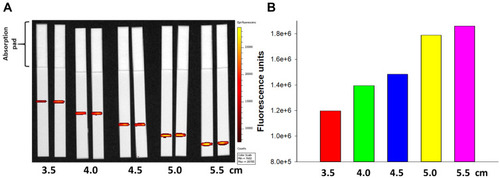
Figure 6 Capture of FNDP-NV-200nm-c13C6-rGP by mAb 6D8.
Notes: (A) Images of HiF-75 strips printed with mAb 6D8 at 1 (1x) and 3 (3x) µg/cm of line length and processed with of FNDP-NV-200nm-c13C6 complexed (+) or not (-) with rGP. Particles and rGP were incubated at 37°C for 5 minutes at a mass ratio of 1:1.3 (particles to rGP). Excess rGP was removed by centrifugation and pellet resuspension in MB to a particle concentration of 1 mg/mL. 1 µg of FNDP-NV-200nm-c13C6-rGP complex was applied to the AZ and mobilized with 40 µL of MB. Line position on the strip was verified by Ponceau S staining. Strips were imaged using IVIS-50 at 1 min exposure time. (B) Quantitation of capture lines in (A) by IVIS-50. Means are graphed. (C–D) Fluorescence microscope images of captured particles on strips from the 3x-printed 6D8 mAb line. Blue arrows indicate the direction of particle flow.
Abbreviations: FNDP-NV-200nm-c13C6-GP, fluorescent nanodiamond particles with NV active centers, 200 nm diameter, coupled to mAb c13C6 mAb and complexed with rGP; HiF, Hi-FlowTM Plus; mAb, monoclonal antibody, rGP, recombinant GP; MB mobilization buffer; AZ, application zone.
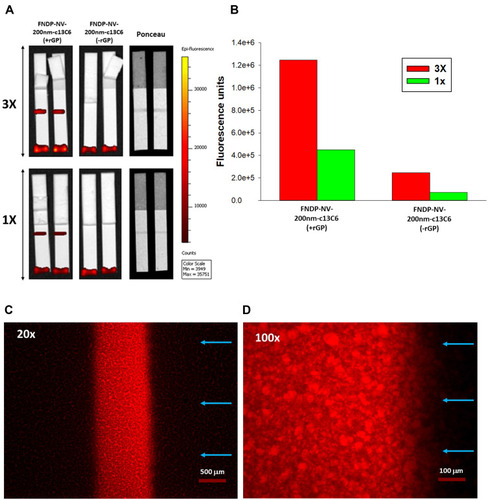
Figure 7 Capture of FNDP-NV-200nm-c13C6-rGP on HiF-75 using mAb 6D8 and GAH-IgG.
Notes: (A) IVIS-50 images of triplicate strips where test lines (T) are closest to the AZ and control lines (C) 5 mm above the test line. FNDP-NV-200nm-c13C6 were incubated with rGP at 37°C for 5 minutes in a mass ratio of 1:1.3 (particles to rGP). Excess rGP was removed by centrifugation and pellet resuspension in MB to a particle concentration of 1 mg/mL. (B) Quantification by IVIS-50 of fluorescent signals at 10-sec or 60-sec excitation times. Bars are the mean of N = 3 ± SD. One-way ANOVA was calculated between test and control lines for all the experimental options. (*) P<0.001 for TD line and TP line; (**) P<0.05 for all options.
Abbreviations: FNDP-NV-200nm-c13C6, fluorescent nanodiamond particles with NV active centers, 200 nm diameter, coupled to humanized chimeric c13C6 monoclonal antibody; mAb, monoclonal antibody; GAH-IgG, goat-anti-human immunoglobulin G; AZ, application zone; rGP, recombinant GP; TD and TP, test lines in distal and proximal positions relative to the top of the strip; CD and CP, control lines distal and proximal relative to the top of the strip; SD, standard deviation.
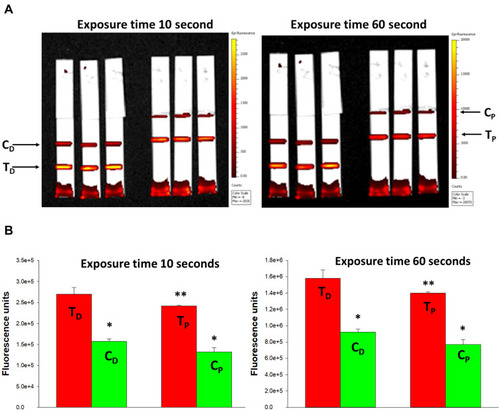
Figure 8 IVIS-50 analysis of strips run with FNDP-NV-200nm-c13C6 preincubated with VLP.
Note: (A) IVIS-50 images of HiF-75 NCM strips. mAb 6D8 was printed on HiF-75 NCM. FNDP-NV-200nm-c13C6 were preincubated with VLP at 37°C for the times indicated above the strips. Excess VLP was removed by pelleting the particles by centrifugation and resuspending the pellets in MB to a particle concentration of 1 mg/mL, from which 20 µL was applied on the membrane followed by 40 µL MB. IVIS-50 images were made using 10 sec. exposures. (B) TEM image of VLPs. Elongated particle resembling EBOV is indicated by red arrows. Image was provided courtesy of Dr. F. Holtsberg (IBT Gaithersburg, MD). (C) Total fluorescence of test lines in (A) as a function of exposure time. Each curve represents a different incubation time of FNDP-NV-200nm-c13C6 with VLP. Background fluorescence from the control strip (no VLP) was subtracted to account for nonspecific interactions. (D) Graphic presentation of total fluorescence intensity retained at the 6D8 capture lines after analysis by IVIS-50. The excitation time for all strips was 10 sec. Fluorescence from the control strip (no VLP) is represented by blue triangle.
Abbreviations: FNDP-NV-200nm-c13C6, fluorescent nanodiamond particles with NV active centers, 200 nm diameter, coupled to humanized chimeric c13C6 monoclonal antibody; VLP, virus-like particles; NCM, nitrocellulose membrane; HiF, Hi-FlowTM Plus; MB, mobilization buffer; EBOV, Ebola virus; mAb, monoclonal antibody; TEM, transmission electron microscopy.
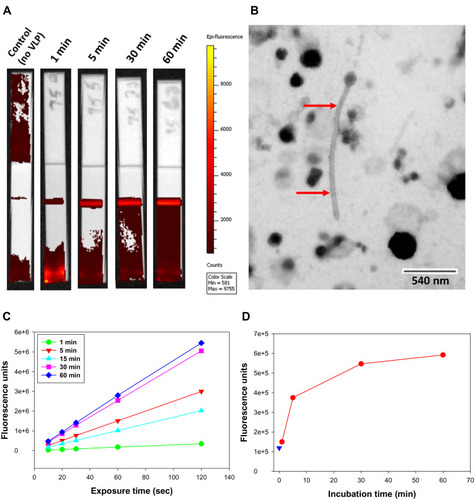
Figure 9 Sensitivity of FNDP-NV-200nm-c13C6-rGP detection using an AX-2X-S OED.
Note: (A) Fluorescence intensity of the test line and control line. Error bars represent SD from the number of replicates indicated by the blue number below each mass of rGP mass (pink numbers). Test Line: (*) P<0.001, (**) P=0.004 and (***) P=0.017 was calculated using One-way ANOVA for difference between strips run with FNDP-NV-200nm-c13C6 and with FNDP-NV-200nm-c13C6-rGP. Control Line: (#) P<0.001, (##) P=0.05 was calculated using One-way ANOVA for difference between strips run with FNDP-NV-200nm-c13C6 and with FNDP-NV-200nm-c13C6-GP (F=12.995). (B) Test line signals for the three lowest rGP masses (green bars) and “0 rGP” control (red bar). Pink numbers below bars represent mass of rGP applied on the application zone while blue numbers indicate the number of independent strips used for each rGP mass. (*) P<0.001, (**) P=0.004 was calculated using One-way ANOVA for difference between strips run with FNDP-NV-200nm-c13C6 and with FNDP-NV-200nm-c13C6-rGP. (C) Screen shot of AX-2X-S OED display. (D) IVIS-50 images of test strips.
Abbreviations: FNDP-NV-200nm-c13C6, fluorescent nanodiamond particles with NV active centers, 200 nm diameter, coupled to chimeric c13C6 monoclonal antibody; rGP, recombinant glycoprotein; mAb, monoclonal antibody; SD, standard deviation; N, number of strips per sample; ng, nanograms.
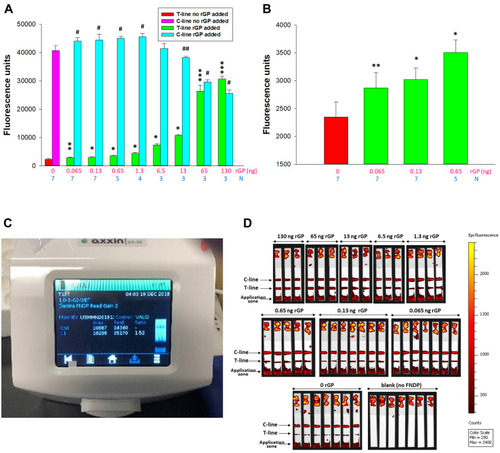
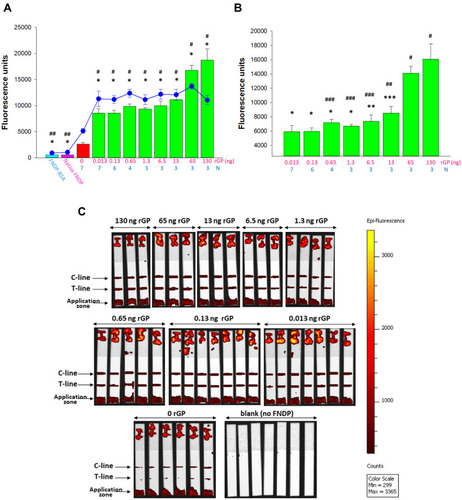
Figure 10 Sensitivity of FNDP-NV-200nm-c13C6-rGP detection in human serum (depleted of IgG) using an AX-2X-S OED.
Notes: (A) Fluorescence intensity of the test line (bar graph) and control line (blue line). Error bars represent SD from the number of replicates indicated by the blue number below each mass of rGP mass (pink numbers). Test Line: (*) P<0.001 and Control Line (#) P<0.001, (##) P=0.003 were calculated using One-way ANOVA for difference between strips run with FNDP-NV-200nm-c13C6 and with FNDP-NV-200nm-c13C6-rGP. (B) Fluorescence intensity of T-line for various amounts of rGP (indicated by pink numbers) deducted by background of FNDP-NV-200nm-c13C6 (rGP = 0 ng). (*) P<0.001, (**) P = 0.003, (***) P = 0.005 were calculated using One-way ANOVA for difference between strips run with the highest (130 ng) amount of rGP. (#) P<0.001, (##) P = 0.003, (###) P<0.05 were calculated using One-way ANOVA for difference between strips run with the lowest (0.013 ng) amount of rGP. (C) IVIS-50 images of test strips.
Abbreviations: FNDP-NV-200nm-c13C6, fluorescent nanodiamond particles with NV active centers, 200 nm diameter, coupled to chimeric c13C6 monoclonal antibody; rGP, recombinant glycoprotein; mAb, monoclonal antibody; SD, standard deviation; N, number of strips per sample; ng, nanograms.