Figures & data
Table 1 Elemental composition of realgar nanoparticles determined by energy dispersive spectrometric analysis
Figure 1 Transmission electron micrograph of realgar nanoparticles.
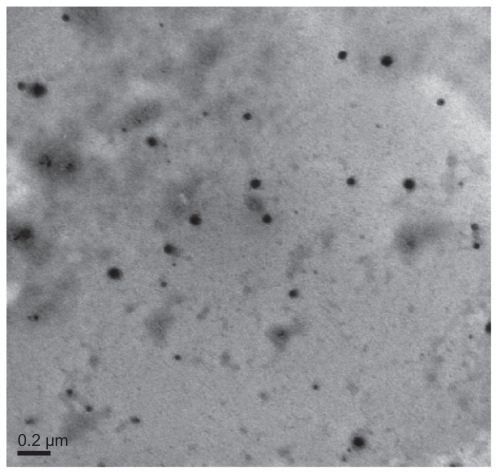
Figure 2 Hydrodynamic diameter distribution of realgar nanoparticles.
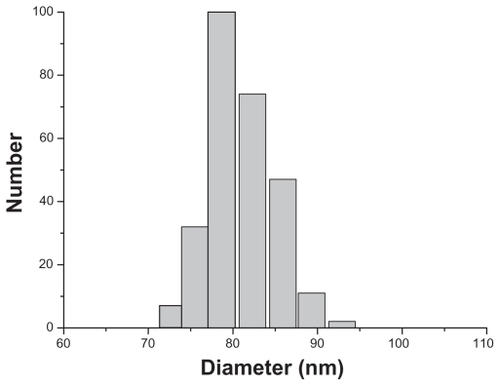
Figure 3 Energy dispersive spectrometric determination of realgar nanoparticle elemental composition.
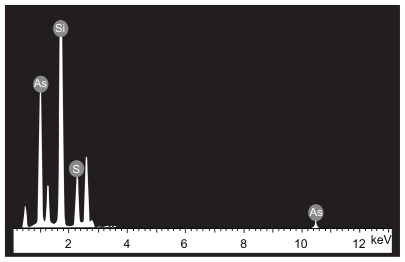
Figure 4 Cytotoxicity of realgar nanoparticles, purified realgar and traditional realgar at 24 hours (A), 48 hours (B), 72 hours (C) in C6 cells.
Note: Each data point shown is the mean ± SD from three independent experiments.
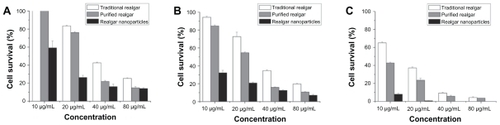
Figure 5 Realgar treatment altered the cell cycle distribution. C6 cells treated with realgar nanoparticles, purified realgar, traditional realgar, or PBS for 24 h were stained with PI and analyzed by flow cytometry (A). Graphical representation of realgar-treated cells in different phases of cellular cycle. Realgar treatment decreased the percentage of cells in G0/G1 and increased the percentages of cells in G2/M and S phases (B).
Notes: Results represent means ± SD of three independent experiments.
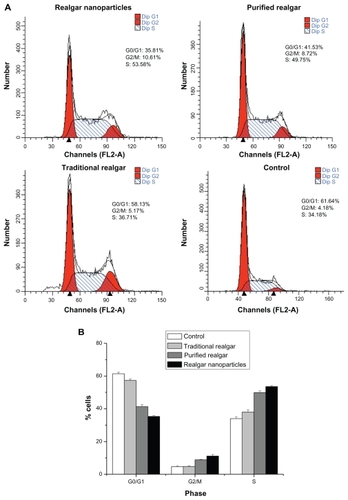
Figure 6 Realgar treatment promoted apoptosis. C6 cells were treated with realgar nanoparticles, purified realgar, traditional realgar, or PBS for 24 hours, stained with Annexin V-FITC/PI, and analyzed by flow cytometry (A). Realgar treatment increased the percentage of apoptotic cells (B).
Note: Results represent means ± SD of three independent experiments.
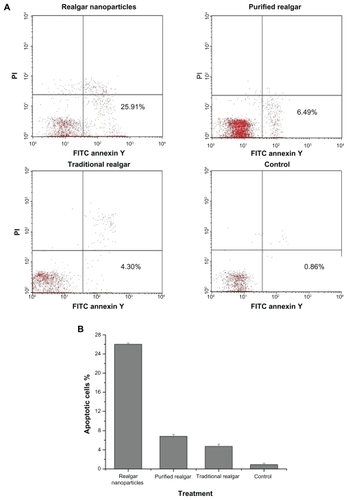
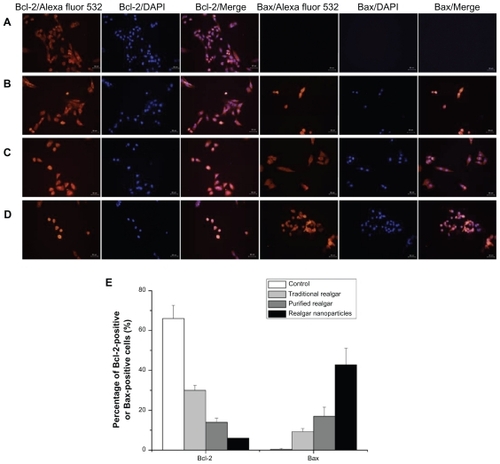
Figure 7 Immunofluorescence staining of Bcl-2 and Bax proteins in C6 cells treated with PBS (A), traditional realgar (B), purified realgar (C), or realgar nanoparticles (D). Semi-quantitative determination of the percentage of Bcl-2-positive or Bax-positive cells (E).
Notes: Magnification, ×400. Experiments were repeated in triplicate. For each sample, the percentage of positive cells was determined by counting four representative areas under the fluorescence microscope.