Figures & data
Table 1 Physiochemical Characteristics of TQ-NLC After 24 Hours
Table 2 Free TQ Detected by HPLC at Wavelength of 254 Nm with Retention Time of 9.7 Minutes
Figure 1 In vitro drug release profile of TQ-NLC and pure TQ solution. The release of TQ from TQ-NLC was lower than pure TQ solution.
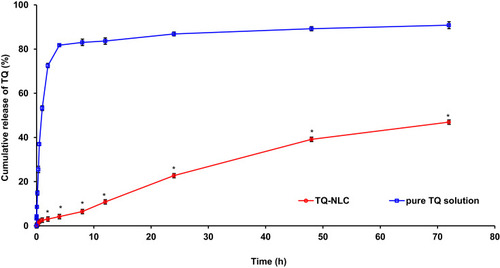
Table 3 Linear Regression of TQ-NLC Release Kinetic by Mathematical Modelling Using Various Drug Kinetic Models
Figure 2 Linear regression of TQ-NLC release kinetic by using Korsmeyer–Peppas equation. The value of n was determined from the gradient of the linear line.
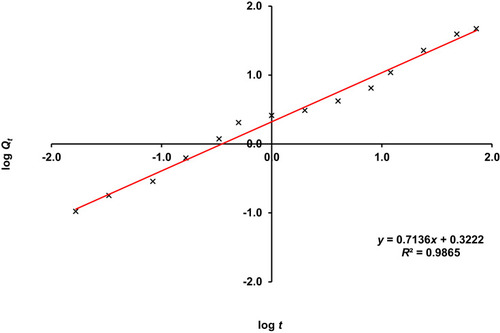
Table 4 Optimisation of Stannous Chloride Amount
Table 5 Stability of 99mTc-TQ-NLC at Room Temperature and in Rat Serum
Table 6 Pharmacokinetics Parameters for 99mTc-TQ-NLC After Oral and Intravenous Administrations into Rats (n=6)
Figure 3 Time profile of 99mTc-TQ-NLC in blood after the oral and intravenous administration into rats (n=6).
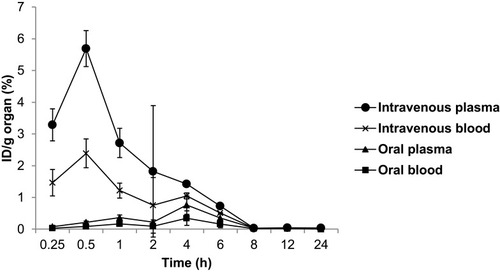
Figure 4 (A) Images of rats administered with 99mTc-TQ-NLC. Gamma camera in vivo data were acquired along 0.25, 0.5, 1, 2, 4, 6, 8, 12, 24 h after the oral administration. (B) Intestine to blood ratios. (C) Intestine to muscle ratios. (D) Liver to blood ratios. (E) Liver to muscle ratios. (F) Kidneys to blood ratios. (G) Kidneys to muscle ratios.
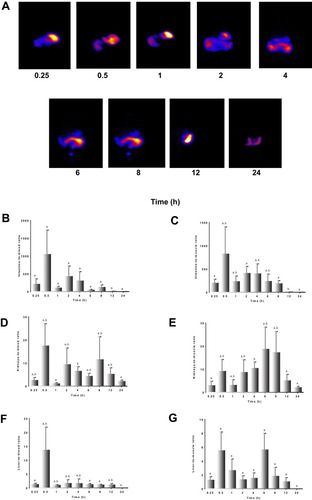
Figure 5 (A) Images of rats administered with 99mTc-TQ-NLC. Gamma camera in vivo data were acquired along 0.25, 0.5, 1, 2, 4, 6, 8, 12, 24 h after the intravenous administration. (B) Intestine to blood ratios. (C) Intestine to muscle ratios. (D) Liver to blood ratios. (E) Liver to muscle ratios. (F) Kidneys to blood ratios. (G) Kidneys to muscle ratios.
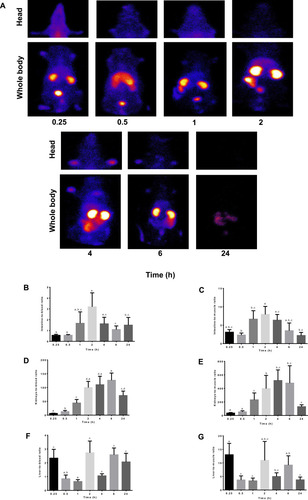
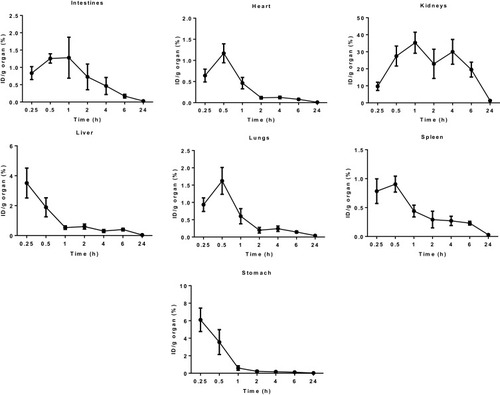
Figure 6 Biodistribution data showing uptake (% ID/g) of organs vs time profile after the oral administration with 99mTc-TQ-NLC (n=6).
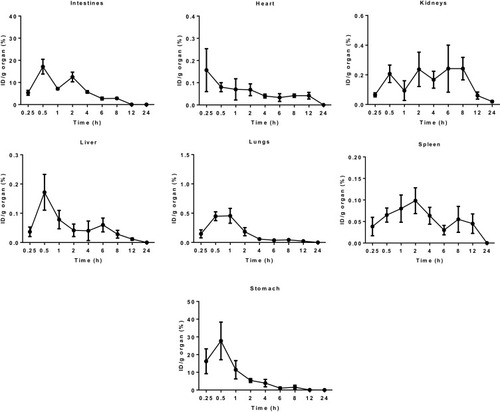
Figure 7 Biodistribution data showing uptake (% ID/g) of organs vs time profile after the intravenous administration with 99mTc-TQ-NLC (n=6).