Figures & data
Table 1 Characteristics of CSO-SA and CSO-SA/OXA micelles
Figure 1 Characteristics of blank micelles and OXA-loaded CSO-SA micelles. (A) Size distribution of CSO-SA micelles and CSO-SA/OXA micelles. (B) TEM image of CSO-SA micelles and CSO-SA/OXA micelles. TEM image of micelles stained with 4% uranyl acetate. (Scale bar, 50 nm.) (C) In-vitro drug-release profile of CSO-SA/OXA micelles in fetal bovine serum at 37°C.
Note: Data are presented as mean ± standard deviation.
Abbreviations: CSO-SA, stearic acid-g-chitosan oligosaccharide; OXA, oxaliplatin; TEM, transmission electron microscopy.
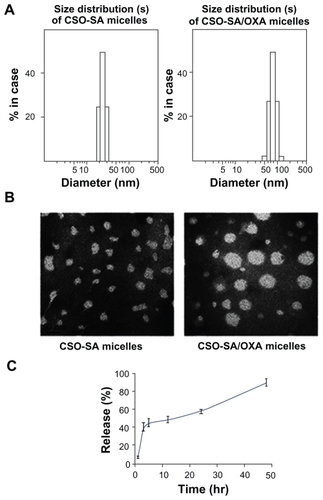
Figure 2 OXA-loaded CSO-SA micelles show excellent internalization ability and enhance Pt accumulation in tumor cells and tissues. (A) Cellular uptake of fluorescein isothiocyanate-labeled CSO-SA/OXA micelles in HT29 spheroids was analyzed by confocal microscope. Images were obtained after cells were incubated with CSO-SA/OXA micelles (OXA content was 10 μg/mL) for 30 minutes, 1 hour, and 2 hours, respectively. (B) The intracellular Pt concentrations increased in HT29 and SW620 spheroids treated with CSO-SA/OXA micelles (OXA content was 10 μg/mL) compared with free OXA (10 μg/mL) (*denotes P < 0.05). Data are presented as mean ± SD. (C) Intravenous administration of CSO-SA/OXA micelles increased Pt accumulation in xenograft tumors (*denotes P < 0.05). Mice received a single injection of free OXA (2 mg/kg) or CSO-SA/OXA micelles (OXA content was 2 mg/kg).
Note: Data are mean ± SD of three tumors per group.
Abbreviations: CSO-SA, stearic acid-g-chitosan oligosaccharide; DAPI, 4′,6-diamidino-2-phenylindole; OXA, oxaliplatin; Pt, platinum; SD, standard deviation.
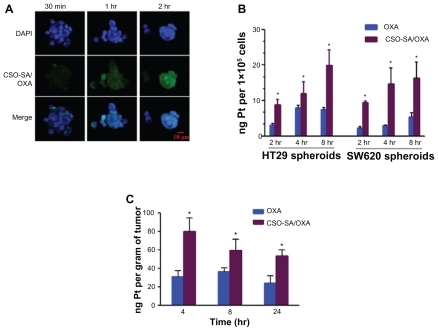
Figure 3 OXA-loaded CSO-SA micelles inhibit proliferation both of colorectal cancer stem-like and bulk cells. The cytotoxicities were analyzed on bulk cells, spheroids, and CD133/CD24 sorted cells of HT29 and SW620 respectively. The cells were treated with different concentrations of OXA and CSO-SA/OXA micelles for 48 hours. The anti-proliferative effect of each drug was measured by MTS assay. (A) Bulk cells of HT29 and SW620. (B) Spheroids. (C) CD133/CD24 sorted cells.
Note: Data are presented as mean ± standard deviation.
Abbreviations: CSO-SA, stearic acid-g-chitosan oligosaccharide; MTS, 3-(4,5-dimethylthiazol-2yl)-2,5-diphenyltetrazolium bromide; OXA, oxaliplatin.
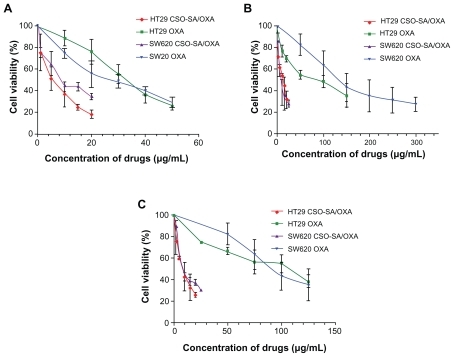
Figure 4 OXA-loaded CSO-SA micelles inhibit formation of spheroids. (A) HT29 and SW620 cells were incubated with OXA (3 μg/mL), CSO-SA/OXA micelles (OXA content was 3 μg/mL), CSO-SA micelles, or 5% glucose for 10–14 days under spheroid-forming conditions, respectively. The size of the spheroids was then visualized under a microscope. (B) Quantification of spheroid formation with HT29 and SW620 cells treated as in (A).
Note: Data are presented as mean ± standard deviation (*denotes P < 0.05).
Abbreviations: CSO-SA, stearic acid-g-chitosan oligosaccharide; OXA, oxaliplatin.
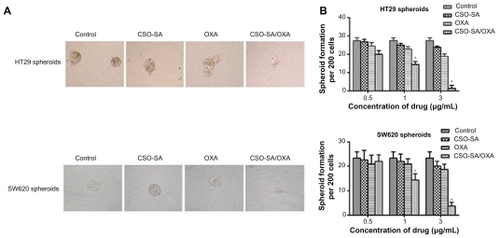
Figure 5 OXA-loaded CSO-SA micelles enhance antitumor efficacy and reduce cancer stem-like cell enrichment in vivo. (A) Reduced size of subcutaneous colon carcinoma tumors derived from spheroid injection of HT29 and SW620 up to 35 days after intravenous treatment with CSO-SA/OXA micelles (OXA content was 2 mg/kg) compared with free OXA (2 mg/kg), CSO-SA micelles, or 5% glucose. Data are mean ± SD of six animals per group. (B) Mice were weighed during the experiment. Each individual mouse’s weight was set to 100% before treatment and bodyweight after treatment was correlated to initial weight. (C) A set of representative flow cytometry plots of the experiments. Q2 covers the region of the double-positive cells. The results show that CSO-SA/OXA micelle treatment did not lead to CD133/CD24+ cell enrichment in tumors.
Note: Data are presented as mean ± SD (*denotes P < 0.05, all others versus OXA group).
Abbreviations: CSO-SA, stearic acid-g-chitosan oligosaccharide; OXA, oxaliplatin; Q1–Q4, quadrant 1–4; SD, standard deviation.
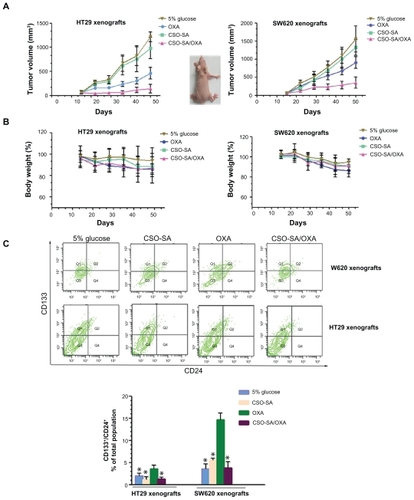
Figure 6 CSO-SA/OXA micelles increase apoptotic events of HT29 xenograft tumors. (A) Enhancement of apoptotic events measured by TUNEL on sections of HT29 xenograft tumors (three per group) treated with CSO-SA/OXA micelles using confocal microscopy analysis. (B) Percentage of apoptotic events measured on sections of (A). A total of 1 × 10⁵ cells per tumor were counted and the percentage of apoptotic cells calculated.
Note: Data are presented as mean ± standard deviation (*denotes P < 0.05).
Abbreviations: CSO-SA, stearic acid-g-chitosan oligosaccharide; DAPI, 4′,6-diamidino-2-phenylindole; OXA, oxaliplatin; TUNEL, TdT-mediated dUTP nick end labeling.
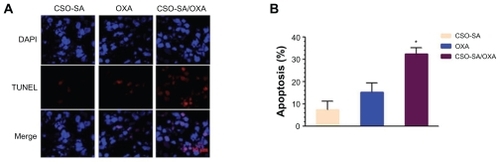
Table S1 IC50 values of CSO-SA micelles, OXA, and CSO-SA/OXA micelles against various cells (μg/mL)
Table S2 Relative tumor inhibitory rate